How to create a Sparkline
Step 1: Open Configuration
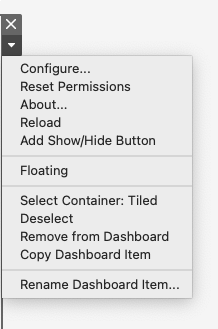
Click on the container that has SuperTables running. This will display an arrow that you can click to open a menu. Upon opening the menu, click the 'Configure...' option to open the configuration panel for SuperTables.

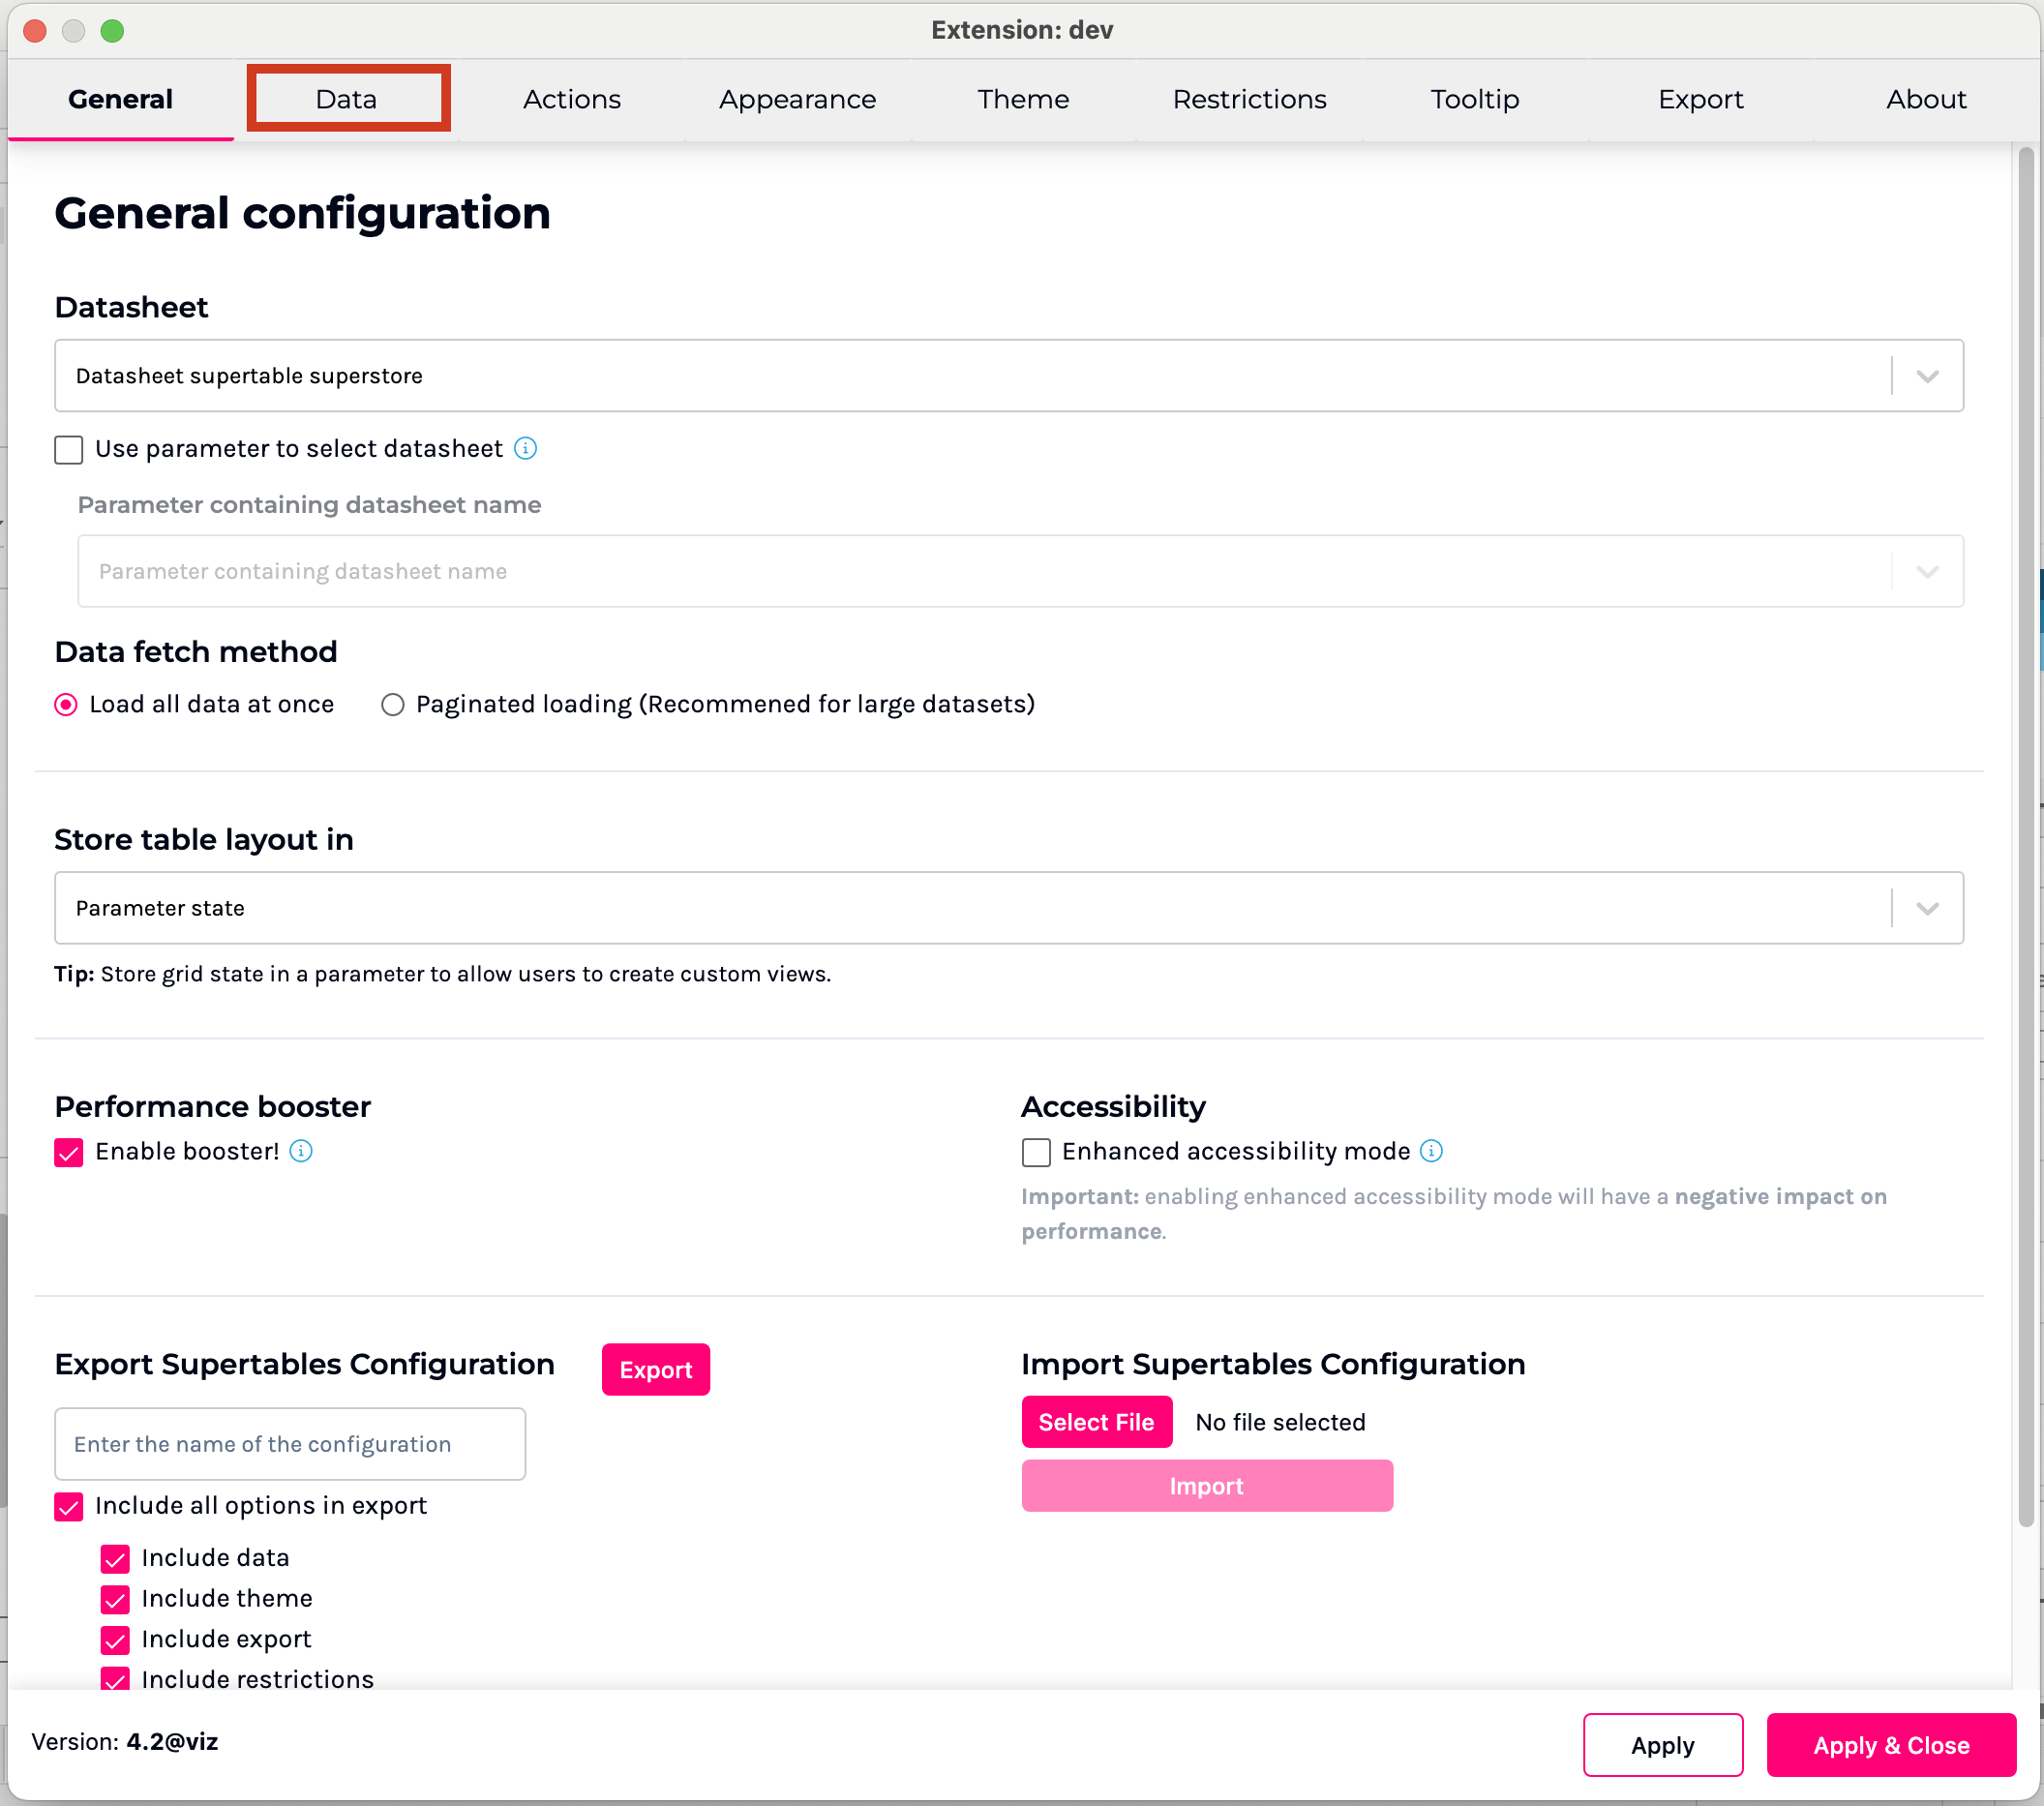
Step 2: Navigate to the Data tab

Step 3: Creating a Sparkline
Expand the 'Sparklines' panel and click on "Make a sparkline" to open the Sparkline configuration panel.

Step 4: Configuring the Sparkline
To configure a Sparkline, give it a suitable display name then select the type of Sparkline you want to display in the cell, the aggregation type you want to aggregate the measure value by, the x-axis and the y-axis.

If you choose a field of type to be one of the axis then a Date Filter panel will be displayed:

Note: When you choose a field of type Date on one of the axis it is recommended to use the Date Filter function. The guide about Date Filtering can be found in Sparkline Date Filtering
Step 5: Click 'Apply' to save and create the Sparkline

Note: The Sparkline will only be rendered when a different field is added to the row group. It will not render when grouping is done using one of the fields already configured for the Y or X axis.
General tips
When using a Sparkline it is recommended to increase the Row height to clearly display the Sparkline as shown in the screenshot in Step 5: Click 'Apply' to save and create the Sparkline
When using a field of type Date, it is recommended to enable the Date filter configurator to configure what dates can be used in the axis. This results in the Sparkline looking neater especially when using the Line and Area Sparkline types.
Last updated