
Dimension Properties
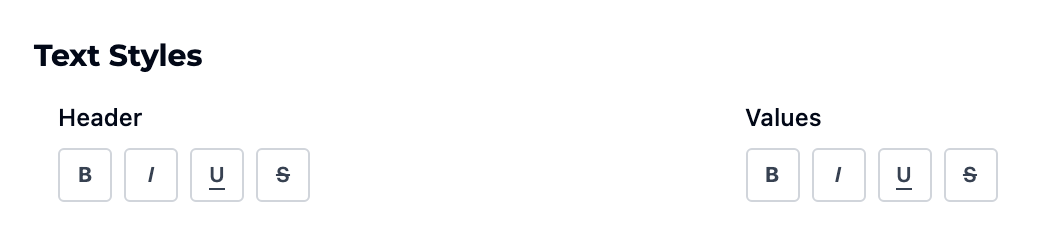
Styles
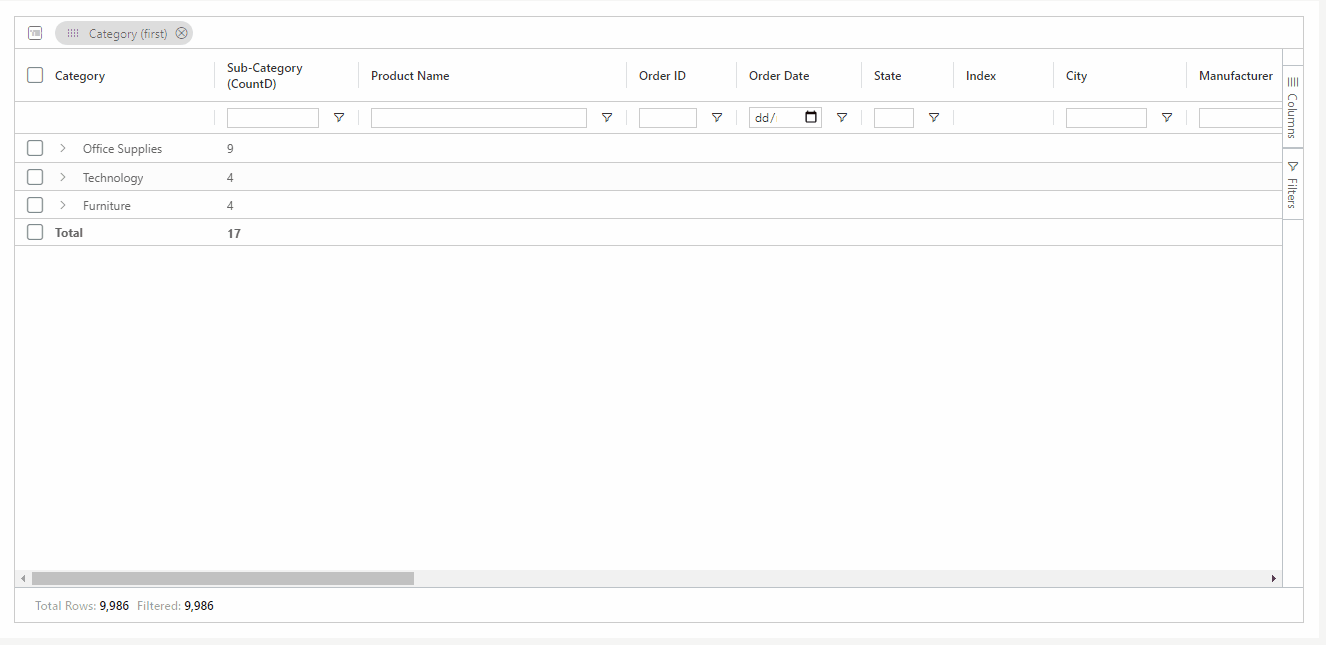
Hide column in sidebar

Hide header name

Hide inline filter

Hide grand total
Show aggregated value when grouping
User can change aggregation method while grouping
Alignment
Header Tooltip


Filter Style

URL Action

Conditional color formatting

Color style
Background color

Last updated
Was this helpful?