
Dimension Format
Here, you can choose the style of your dimension. Plenty of options such as a Text field, a URL that can be rendered into an image, HTML, Markdown or even an emoji:
Text
The text field will view similar to what you’d see in a Tableau table.

Image
If your dimension holds data of an image URL, have that shown in your SuperTable. Add the width and height in px into the text boxes to set the proportions of the image. A good tip is to enable ‘auto row height based on cell content’ under the Appearance tab to enable larger images in the grid and have the row height automatically calculated. We suggest setting at least one of the dimensions of the image size for better layout control. Leave the width and/or height empty for auto-detection and show the full image (max sizes).
You can use base64 encoded images by creating a column in your dataset or calculated field to store these values as strings.

HTML
Would you like videos shown within your Supertable? If your data holds embedded HTML, choose HTML as your dimension Type.

Markdown
Use the markdown language on your dimension. Such as header styles, # and more. Use this website to see the markdown language that can be used in SuperTables.

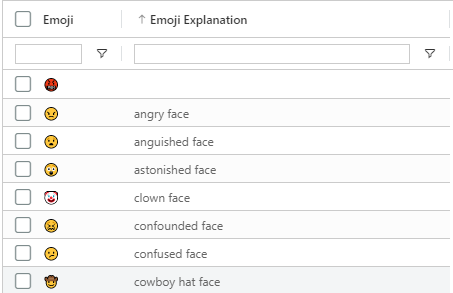
Emoji
Using the emoji codes in your dataset, show emojis in your SuperTable.

You can find the emoji codes here
Date Format
If your dimension is a date type, you can format the date in the view. For example “YYYY-MM” to 2025-05 for May 2025.

Filter date
Filter now on a date part including exact date or even a range of dates. Want to show data over a specific time, easily filter your date to show in your viz.
Formatted date fields in SuperTables can now be used for aggregation. So if you have an exact date field in your dataset, and format the column to show only Year and Month you can aggregate that column (using the grouping bar) on Year-Month and the exact dates are aggregated based on your date formatting.
Last updated
Was this helpful?