
Grouping Options
Enable Group bar
Show or hide the grouping bar in SuperTables. This enables or disables your dashboard users to do custom groupings on the dataset you offer in your SuperTable instance.
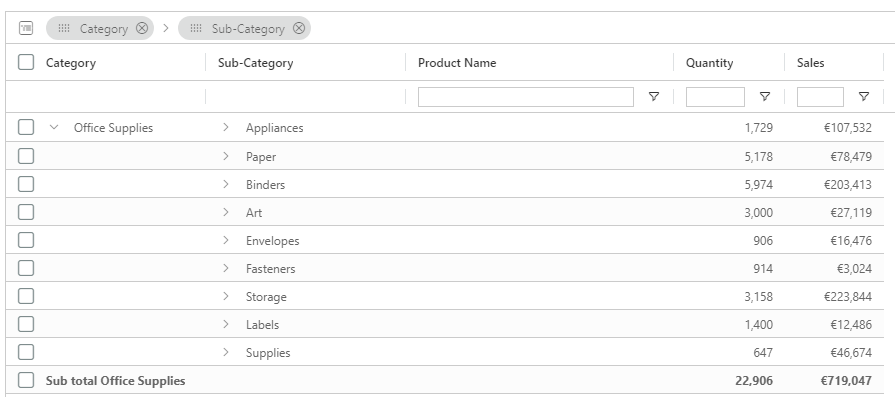
Enable group totals within each group level
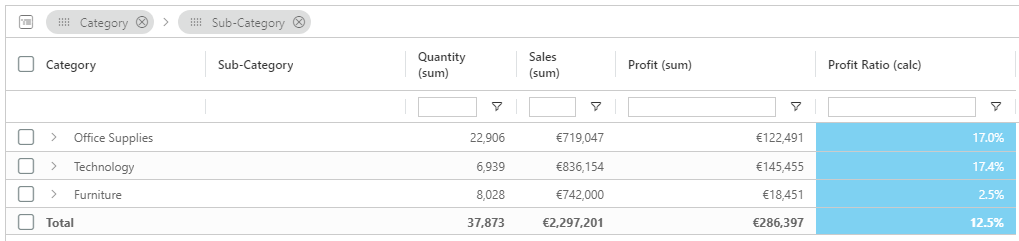
Each level will show a total of the group. Below, an example of the group total for “Office Supplies”:
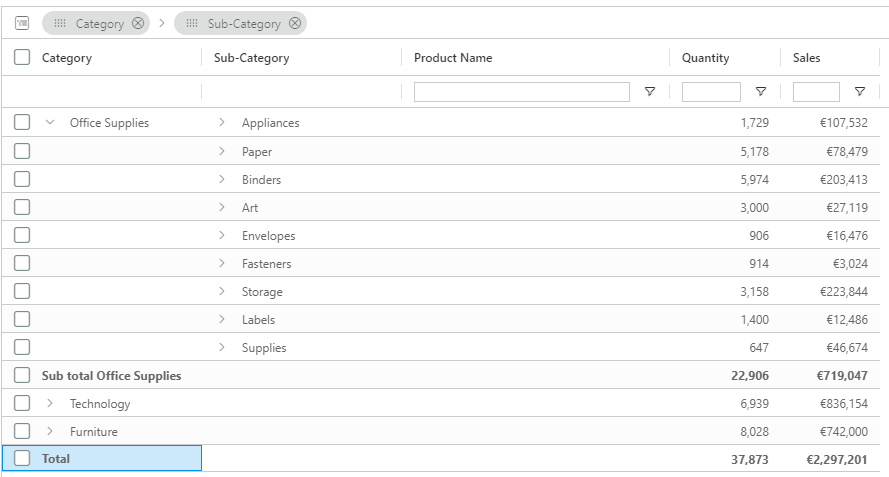
Enable a ‘grand’ total across all groups
Show a grand total of all groups in your SuperTable view.
View grand total at the top of the table
Show the grand total (pinned) at the top of your SuperTable view.
Enable Group aggregation filtering
By default, column filters are not applied to cell values shown in Group Rows as they do not usually have any data of their own. However when using Aggregation, group rows will show aggregated values computed based on their child rows. You can filter the grid based on the group row aggregated values by enabling this setting.
When Group is expanded, hide the parent row
SuperTables allows you to hide the parent row while drilling down in your table. Below, an example with the parent row enabled:

Also an example with this option set to hide the parent row:
Note: Enabling this option automatically disables "Enable sticky group rows" and "Enable sticky group total rows" options as they are mutually exclusive.
Enable sticky row groups
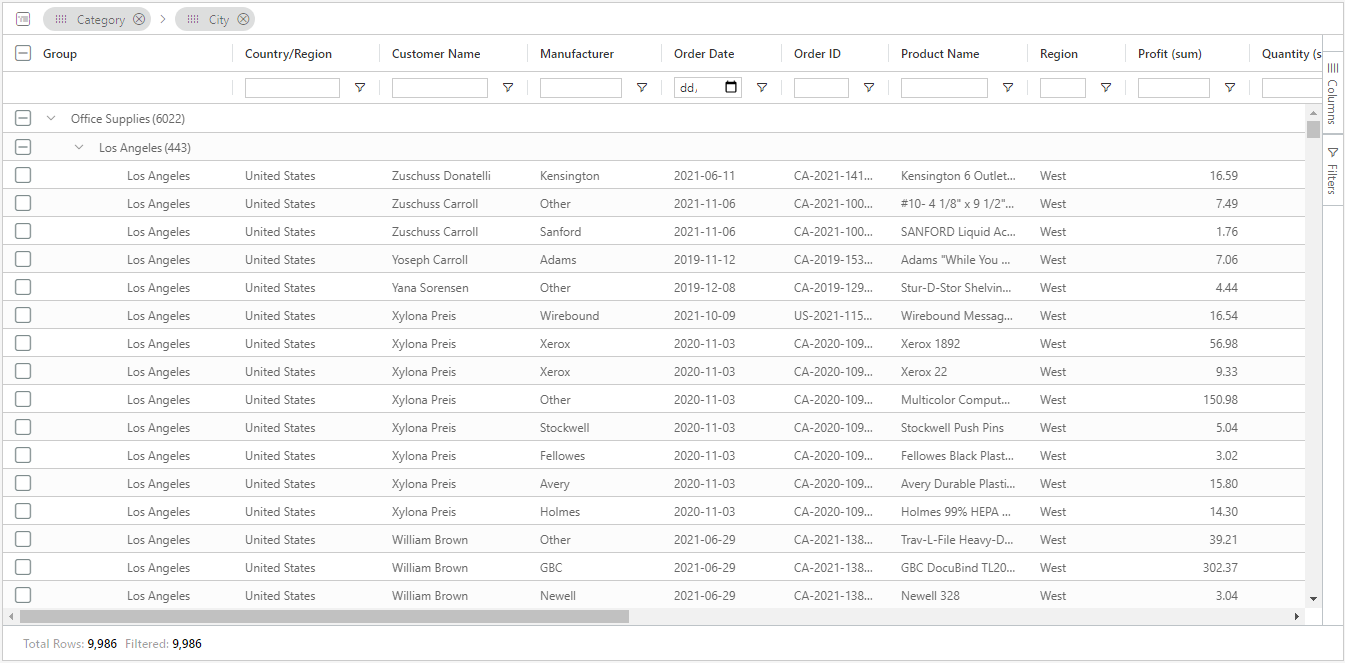
This option will make the group rows stick to the top of the table when scrolling down, meaning that the parent row of a group will remain visible while scrolling through the underlaying rows. Enabling this option disables the "When group is expanded, hide the parent row" option.
Enable sticky group total rows
This option will make the group total rows will stick to the top/bottom of the table when scrolling. Enabling this option disables the "When group is expanded, hide the parent row" option.
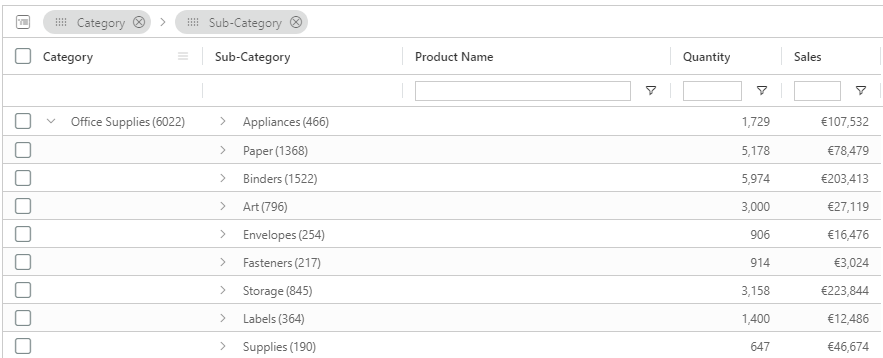
Hide the number of rows counter behind a group row
Normally, SuperTables shows the number of rows contained in a group or aggregation. With this switch you can turn off this row counter. By default, SuperTables shows a row counter when grouping:
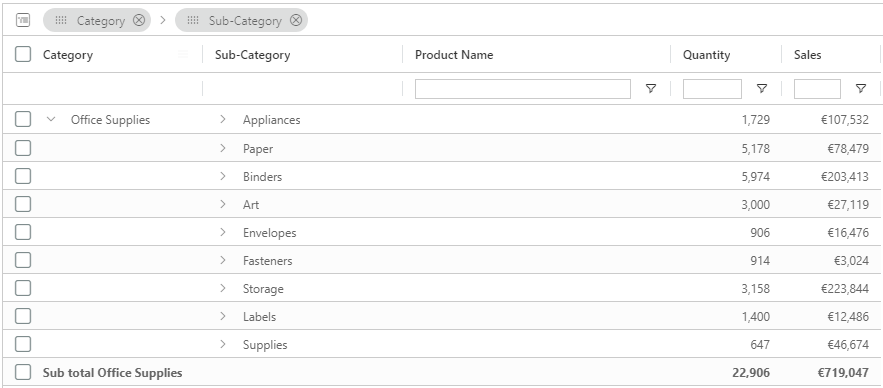
You can switch this off and then the SuperTable groupings look like this:
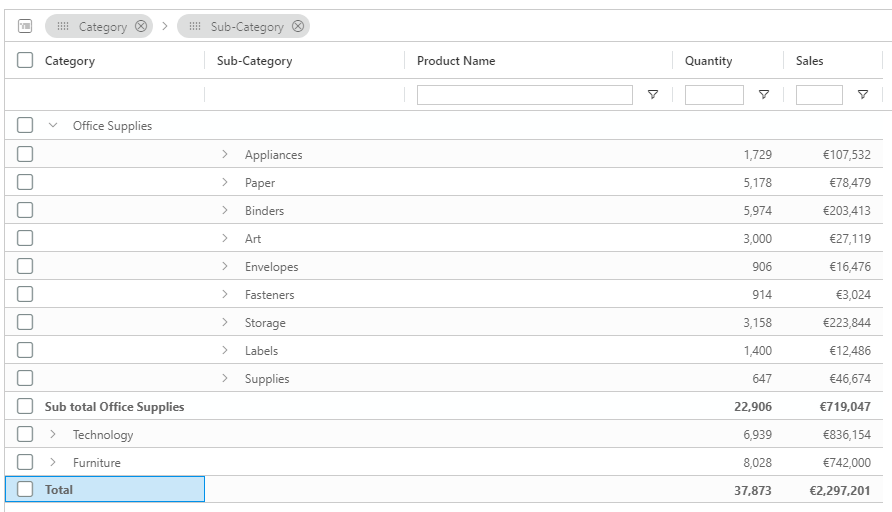
Use multiple columns for grouping
When you use the grouping bar, SuperTables uses one column for the group by default. With this option, you can force SuperTables to use a dedicated column for each member of the grouping hierarchy. Example: Below you see a custom group of “Category” and “Sub category” where there is also a separate column for “Sub category”:
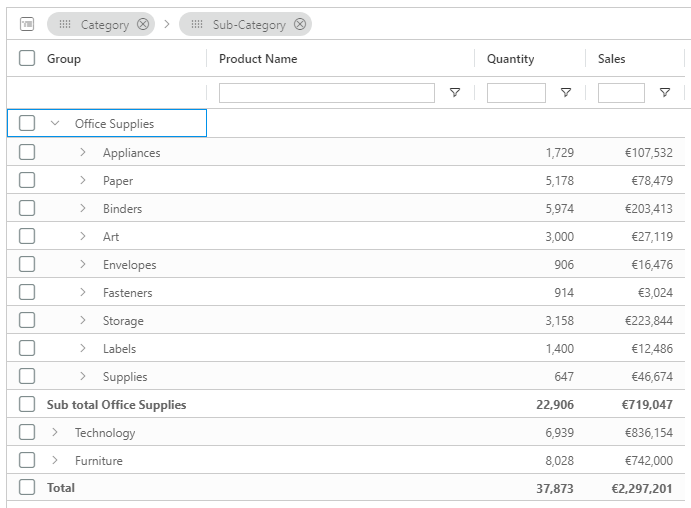
Default SuperTables combines the grouped dimensions into one column called “Group”:
Show opened group names on the rows below
This is useful when the user scrolls down through the children of the group, and the row showing what group was opened is scrolled out of view.
Show aggregation function in header
When using Measures in your SuperTable, the aggregation of the column can be shown in the SuperTable column header using this switch:
Automatically expand grouped rows
If your SuperTables has multiple groups, you can set it to open on a specified level by default. If you have, for instance, 3 group levels, you can choose to expand it by default on the first level by setting this value to 2.
Group value empty or null
Replace the empty group or null with a message of your choice, leave empty for default.
Enable URL actions for grouped values
If you are using dynamic values in the URL it will use the first row found in the grouped data to generate the URL. Deselecting will deactivate the URL action on the grouped level.
Unbalanced Groups
If there are rows containing null or undefined values for the column that is being grouped then these rows will not be grouped. This is called unbalanced grouping. If the null values should be in a column that’s current in your dataset you can set a replacement column using the dropdown. Wherever there are nulls or undefigned values, this column will be used for all.

Event listeners
Here, you can choose on what events the SuperTable should be updated from the dashboard
Update when any Tableau filter or Dashboard action changed the datasheet
Your SuperTable will be updated (reloaded) when any filter or dashboard action changed the datasheet.
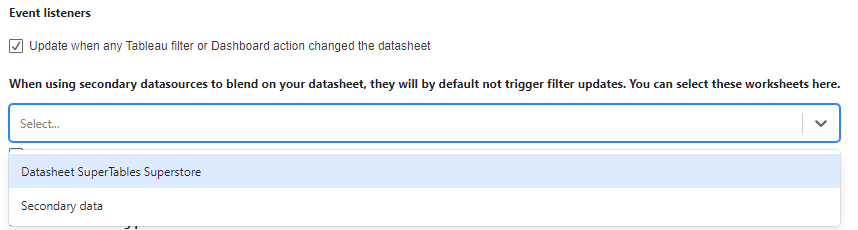
When using secondary datasources to blend on your datasheet, they will by default not trigger filter updates. You can select these worksheets here.
Use the dropdown to choose the secondary datasource. This worksheet will need to be present on your dashboard.
Update on a mark selection in the datasheet
Your SuperTable will be updated on a mark selection in the datasheet that feeds the extension.
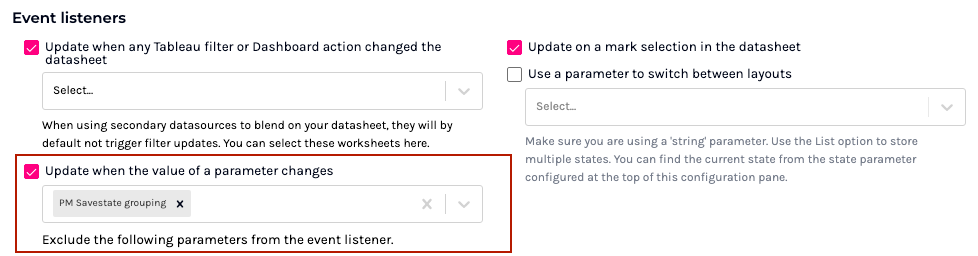
Update when the value of a parameter changes
Your SuperTable will be updated when the value of a parameter changes.
Exclude the following parameters from the event listener
In some use cases you might want your SuperTables extension to respond to parameter changes, but not to all parameter. For instance, when you have two SuperTables instances on the same dashboard that have their settings stored in a parameter, you might want your SuperTable to exclude to respond on that settings parameter changes.
Last updated
Was this helpful?