ShowMeMore
WebsiteAll products
  • Introduction
    • Getting started with ShowMeMore
      • Guide to the first VizExtension
      • Getting started with dashboard extension
  • Visualization Types
  • Sankey Diagram
    • Data strucuture
    • Configuration Screen
    • Format
    • Color formatting
      • Text and background
      • Color Nodes
      • Color Links
    • Text formatting
      • Labels
      • Tooltips
      • Measures
    • Legend
    • Dashboard Actions
  • Source Target Sankey Diagram
    • Data strucuture
    • Configuration Screen
    • Format
    • Color formatting
      • Text and background
      • Color Nodes
      • Color Links
    • Text formatting
      • Labels
      • Tooltips
      • Measures
    • Dashboard Actions
  • Waterfall Chart
    • Data structure
    • Configuration Screen
    • Format
    • Labels
    • Measures
    • Color
    • Dashboard Actions
  • Geo Sankey Diagram
    • Data structure
    • Configuration Screen
    • Format
    • Tooltips
    • Labels
    • Dashboard Actions
    • Color
  • Network Diagram 2.0
    • Data structure
    • Configuration Screen
    • Analytics Options
    • Labels
    • Tooltip
    • Measures
    • Color
    • Format
    • Dashboard Actions
  • Radar Chart
    • Data structure
    • Configuration Screen
    • Format
    • Labels
    • Tooltips
    • Measures
    • Color
    • Legend
    • Dashboard Actions
  • Venn Diagram
    • Data structure
    • Configuration Screen
    • Format
    • Color
    • Labels
    • Tooltips
    • Measures
    • Legend
    • Dashboard Actions
  • Sunburst New Diagram
    • Data structure
    • Configuration Screen
    • Format
    • Tooltips
    • Measures
    • Labels
    • Color
    • Legend
    • Dashboard Actions
  • Sunburst diagram
    • Data structure
    • Configuration Screen
    • Format
    • Tooltips
    • Measures
    • Labels
    • Color
    • Legend
  • Chord Diagram
    • Data structure
    • Configuration Screen
    • Format
    • Color
    • Tooltips
    • Measures
    • Labels
    • Legend
    • Dashboard Actions
  • Circular Sankey Diagram
    • Data structure
    • Configuration Screen
    • Format
    • Tooltips
    • Measures
    • Labels
    • Dashboard Actions
    • Color
    • Legend
  • Ridgeline Plot
    • Data strucutre
    • Configuration Screen
    • Format
    • Color
    • Tooltips
    • Labels
    • Dashboard Actions
  • Horizon Chart
    • Data structure
    • Configuration Screen
    • Format
    • Labels
    • Color
    • Labels
  • Organization Chart
    • Data structure
    • Configuration Screen
    • Format
    • Color
    • Tooltips
    • Measures
    • Labels
    • Dashboard Actions
  • Calendar Chart
    • Configuration Screen
    • Labels
    • Measures
    • Color
    • Format
  • Network Diagram
  • Export Visualization
  • Troubleshot
    • Sankey Diagram crashes or fails to load
  • FAQ
    • Is the Waterfall Chart built directly from the data, or do I need custom calculations?
Powered by GitBook
On this page
  1. Venn Diagram

Configuration Screen

PreviousData structureNextFormat

Last updated 9 months ago

Select Data Sheet

Select the worksheet you want to use as a datasheet for your Venn diagram. This worksheet will be the input for the visualization (Venn Diagram) you pick in the next step.

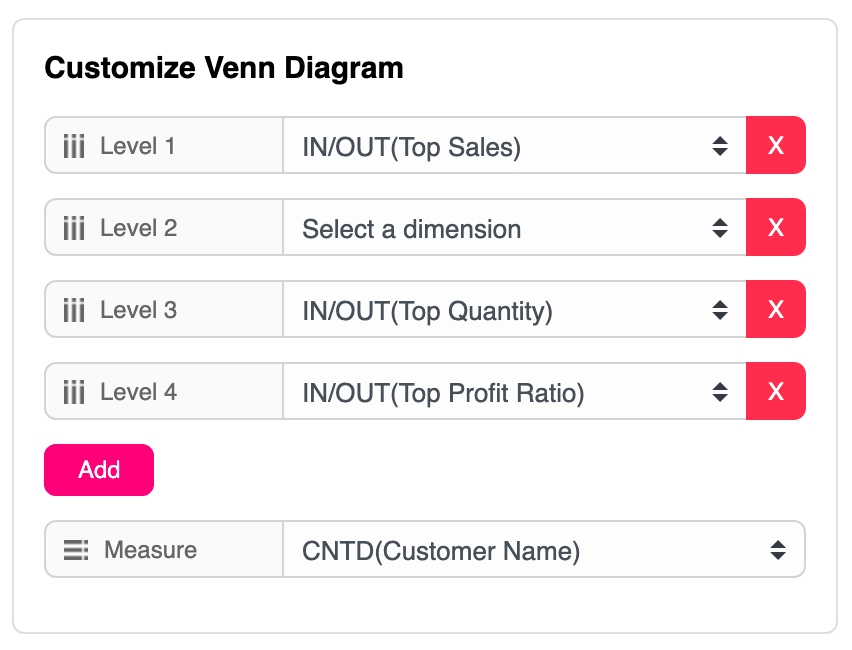
Customize Venn Diagram

Please select the sets you want to include in your Venn diagram from the dropdown menus provided (such as Top customer's Sales, Top customers Profit, and Top customers Quantity). The chosen sets will be represented by spheres, with size corresponding to the chosen measure (i.e., the number of unique customers). You can use the 'Add' button if you wish to add an extra set to your Venn Diagram.