ShowMeMore
WebsiteAll products
  • Introduction
    • Getting started with ShowMeMore
      • Guide to the first VizExtension
      • Getting started with dashboard extension
  • Visualization Types
  • Sankey Diagram
    • Data strucuture
    • Configuration Screen
    • Format
    • Color formatting
      • Text and background
      • Color Nodes
      • Color Links
    • Text formatting
      • Labels
      • Tooltips
      • Measures
    • Legend
    • Dashboard Actions
  • Source Target Sankey Diagram
    • Data strucuture
    • Configuration Screen
    • Format
    • Color formatting
      • Text and background
      • Color Nodes
      • Color Links
    • Text formatting
      • Labels
      • Tooltips
      • Measures
    • Dashboard Actions
  • Waterfall Chart
    • Data structure
    • Configuration Screen
    • Format
    • Labels
    • Measures
    • Color
    • Dashboard Actions
  • Geo Sankey Diagram
    • Data structure
    • Configuration Screen
    • Format
    • Tooltips
    • Labels
    • Dashboard Actions
    • Color
  • Network Diagram 2.0
    • Data structure
    • Configuration Screen
    • Analytics Options
    • Labels
    • Tooltip
    • Measures
    • Color
    • Format
    • Dashboard Actions
  • Radar Chart
    • Data structure
    • Configuration Screen
    • Format
    • Labels
    • Tooltips
    • Measures
    • Color
    • Legend
    • Dashboard Actions
  • Venn Diagram
    • Data structure
    • Configuration Screen
    • Format
    • Color
    • Labels
    • Tooltips
    • Measures
    • Legend
    • Dashboard Actions
  • Sunburst New Diagram
    • Data structure
    • Configuration Screen
    • Format
    • Tooltips
    • Measures
    • Labels
    • Color
    • Legend
    • Dashboard Actions
  • Sunburst diagram
    • Data structure
    • Configuration Screen
    • Format
    • Tooltips
    • Measures
    • Labels
    • Color
    • Legend
  • Chord Diagram
    • Data structure
    • Configuration Screen
    • Format
    • Color
    • Tooltips
    • Measures
    • Labels
    • Legend
    • Dashboard Actions
  • Circular Sankey Diagram
    • Data structure
    • Configuration Screen
    • Format
    • Tooltips
    • Measures
    • Labels
    • Dashboard Actions
    • Color
    • Legend
  • Ridgeline Plot
    • Data strucutre
    • Configuration Screen
    • Format
    • Color
    • Tooltips
    • Labels
    • Dashboard Actions
  • Horizon Chart
    • Data structure
    • Configuration Screen
    • Format
    • Labels
    • Color
    • Labels
  • Organization Chart
    • Data structure
    • Configuration Screen
    • Format
    • Color
    • Tooltips
    • Measures
    • Labels
    • Dashboard Actions
  • Calendar Chart
    • Configuration Screen
    • Labels
    • Measures
    • Color
    • Format
  • Network Diagram
  • Export Visualization
  • Troubleshot
    • Sankey Diagram crashes or fails to load
  • FAQ
    • Is the Waterfall Chart built directly from the data, or do I need custom calculations?
Powered by GitBook
On this page

Organization Chart

PreviousLabelsNextData structure

Last updated 9 months ago

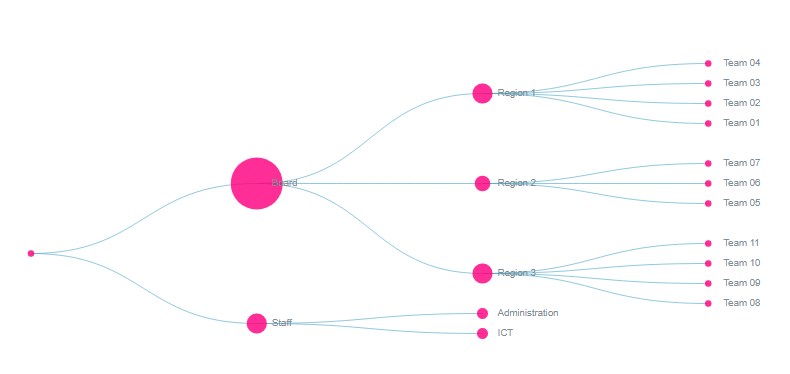
The organization chart is a diagram showing graphically the relation of one official to another, or others, of a company. It is also used to show the relation of one department to another, or others, or of one function of an organization to another, or others. This chart is valuable in that it enables one to visualize a complete organization, by means of the picture it presents.

Organization Charts are highly customizable follow one of the pages to customize specific aspects of the diagram: