ShowMeMore
WebsiteAll products
  • Introduction
    • Getting started with ShowMeMore
      • Guide to the first VizExtension
      • Getting started with dashboard extension
  • Visualization Types
  • Sankey Diagram
    • Data strucuture
    • Configuration Screen
    • Format
    • Color formatting
      • Text and background
      • Color Nodes
      • Color Links
    • Text formatting
      • Labels
      • Tooltips
      • Measures
    • Legend
    • Dashboard Actions
  • Source Target Sankey Diagram
    • Data strucuture
    • Configuration Screen
    • Format
    • Color formatting
      • Text and background
      • Color Nodes
      • Color Links
    • Text formatting
      • Labels
      • Tooltips
      • Measures
    • Dashboard Actions
  • Waterfall Chart
    • Data structure
    • Configuration Screen
    • Format
    • Labels
    • Measures
    • Color
    • Dashboard Actions
  • Geo Sankey Diagram
    • Data structure
    • Configuration Screen
    • Format
    • Tooltips
    • Labels
    • Dashboard Actions
    • Color
  • Network Diagram 2.0
    • Data structure
    • Configuration Screen
    • Analytics Options
    • Labels
    • Tooltip
    • Measures
    • Color
    • Format
    • Dashboard Actions
  • Radar Chart
    • Data structure
    • Configuration Screen
    • Format
    • Labels
    • Tooltips
    • Measures
    • Color
    • Legend
    • Dashboard Actions
  • Venn Diagram
    • Data structure
    • Configuration Screen
    • Format
    • Color
    • Labels
    • Tooltips
    • Measures
    • Legend
    • Dashboard Actions
  • Sunburst New Diagram
    • Data structure
    • Configuration Screen
    • Format
    • Tooltips
    • Measures
    • Labels
    • Color
    • Legend
    • Dashboard Actions
  • Sunburst diagram
    • Data structure
    • Configuration Screen
    • Format
    • Tooltips
    • Measures
    • Labels
    • Color
    • Legend
  • Chord Diagram
    • Data structure
    • Configuration Screen
    • Format
    • Color
    • Tooltips
    • Measures
    • Labels
    • Legend
    • Dashboard Actions
  • Circular Sankey Diagram
    • Data structure
    • Configuration Screen
    • Format
    • Tooltips
    • Measures
    • Labels
    • Dashboard Actions
    • Color
    • Legend
  • Ridgeline Plot
    • Data strucutre
    • Configuration Screen
    • Format
    • Color
    • Tooltips
    • Labels
    • Dashboard Actions
  • Horizon Chart
    • Data structure
    • Configuration Screen
    • Format
    • Labels
    • Color
    • Labels
  • Organization Chart
    • Data structure
    • Configuration Screen
    • Format
    • Color
    • Tooltips
    • Measures
    • Labels
    • Dashboard Actions
  • Calendar Chart
    • Configuration Screen
    • Labels
    • Measures
    • Color
    • Format
  • Network Diagram
  • Export Visualization
  • Troubleshot
    • Sankey Diagram crashes or fails to load
  • FAQ
    • Is the Waterfall Chart built directly from the data, or do I need custom calculations?
Powered by GitBook
On this page

Circular Sankey Diagram

PreviousDashboard ActionsNextData structure

Last updated 11 months ago

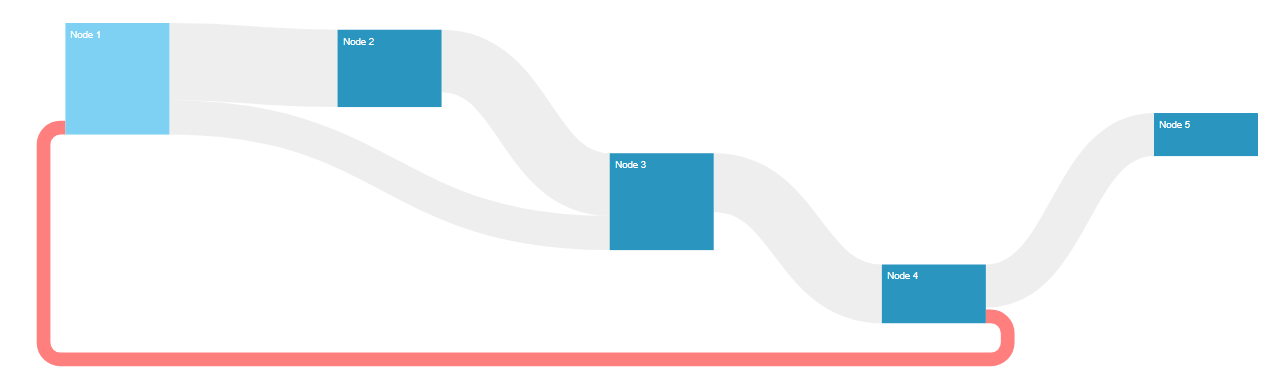
The Circular Sankey Diagram visualizes the flow of a measure over multiple dimensions with internal loops. Sankey diagrams are a type of flow diagram in which the width/height of the arrows is proportional to the flow rate.

Circular Sankey Diagram are highly customizable follow one of the pages to customize specifics aspects of the diagram:

Configuration Screen
Dashboard Actions
Color
Format
Legend