
Happy path
ProcessMining allows you to configure a “Happy Path”. The Happy Path is not automatically calculated, it is not the most common nor the most frequent occurring path in your dataset but can it be configured as the (imaginary) ideal path you want to be followed for the process. Outliers can be spotted immediately and action can be taken!
The Happy Path is drawn as a vertical straight line from the Start node to the End node
The Happy path activities and paths can be represented in a different color
Hit “Enable happy path” to have the opportunity to show the Happy Path in your Process Map. Click the ‘Visible when filter sheet(s)’ this will show the activities of the Happy Path in the visualisation even when your filtered data does not contain the Happy Path activities. The unused “Happy Path” nodes will be greyed out but still be visible. When false all non-connected nodes will be filtered from the tree.
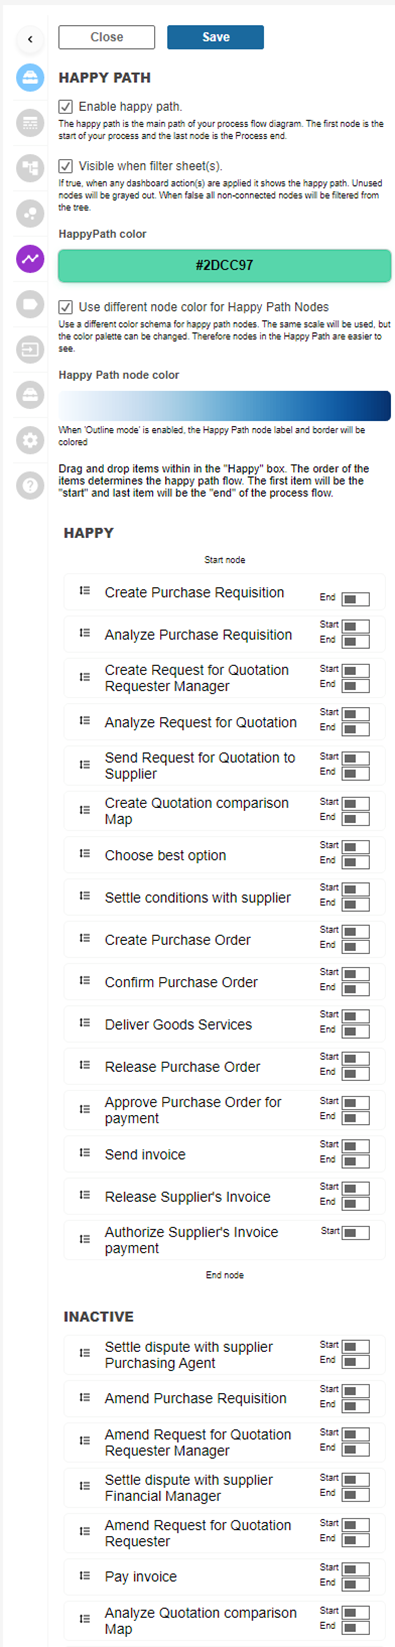
Happy path color
Use the color palette to change the happy path color for activities shown in your viz. You’re able to use RGB, HEX & HSL codes.
Check the ‘Use a different color schema for happy path nodes’. The same scale will be used, but the color palette can be changed. Therefore outliers are easier to spot. Outliers will not be shown on the vertical line and have a different color. Clicking the color palette will open up the color gradients you’re able to choose from.
Creating the happy path
Now we can use the “HAPPY” and “INACTIVE” panes to configure the Happy Path. Initially there will be no activities shown under “HAPPY” and all activities will be present in the “INACTIVE” pane. You can now drag activities from the “INACTIVE” pane to the “HAPPY” Pane. Make sure you position the activities in the order of the process flow you want to be visible in your Happy Path.
Per activity you can indicate if the activity is allowed to be a start point of your process or an exit point (end point). This will draw Happy Path lines to the start and end nodes of the Process Map.
Last updated
Was this helpful?