
Format activities
Format Activities
Here you can change the look and feel of activities in your ProcessMining visualisation. Format your activities to give the best looks to your dashboard with respect to yout use case.
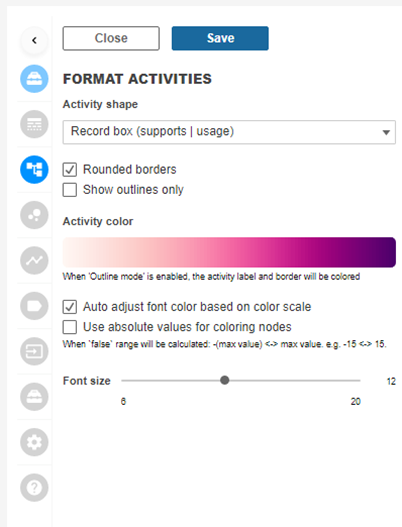
Activity shape
Change the shape of your activities in your process map. Select a shape you like to visualize the nodes in the process map. By default the ‘Record box’ is used. This is the most common activity shape used in Process Maps. Here you have the option to have rounded edges turned on or off on your nodes. Change the whole look of your viz by having the nodes outlined only. This will trigger below the option to change the style of your outlines.
Activity color
Click on the gradient to choose from the selection of colors for your viz. This may effect the visibility of the font color to be sure check the ‘Auto adjust font color based on color scale’ for the extension work out the best color balance. This option sets the default color of activities in your Process Map. In a later step we tell you how to set the color of activities that reside in your Happy Path. The ‘outliers’ of your happy path will have the default color that is set with this option. So if you plan on using and visualizeing a happy path, it might be wise to select a signaling color as default color…
Use absolute values for coloring nodes
The values will round to the nearest absolute node and then be colored by that value. It often results in wider color variations in your process map, just try and see what best fits your use case.
Font size
Use the scroller to change the font size within your activities.
Last updated
Was this helpful?