
Detail slider
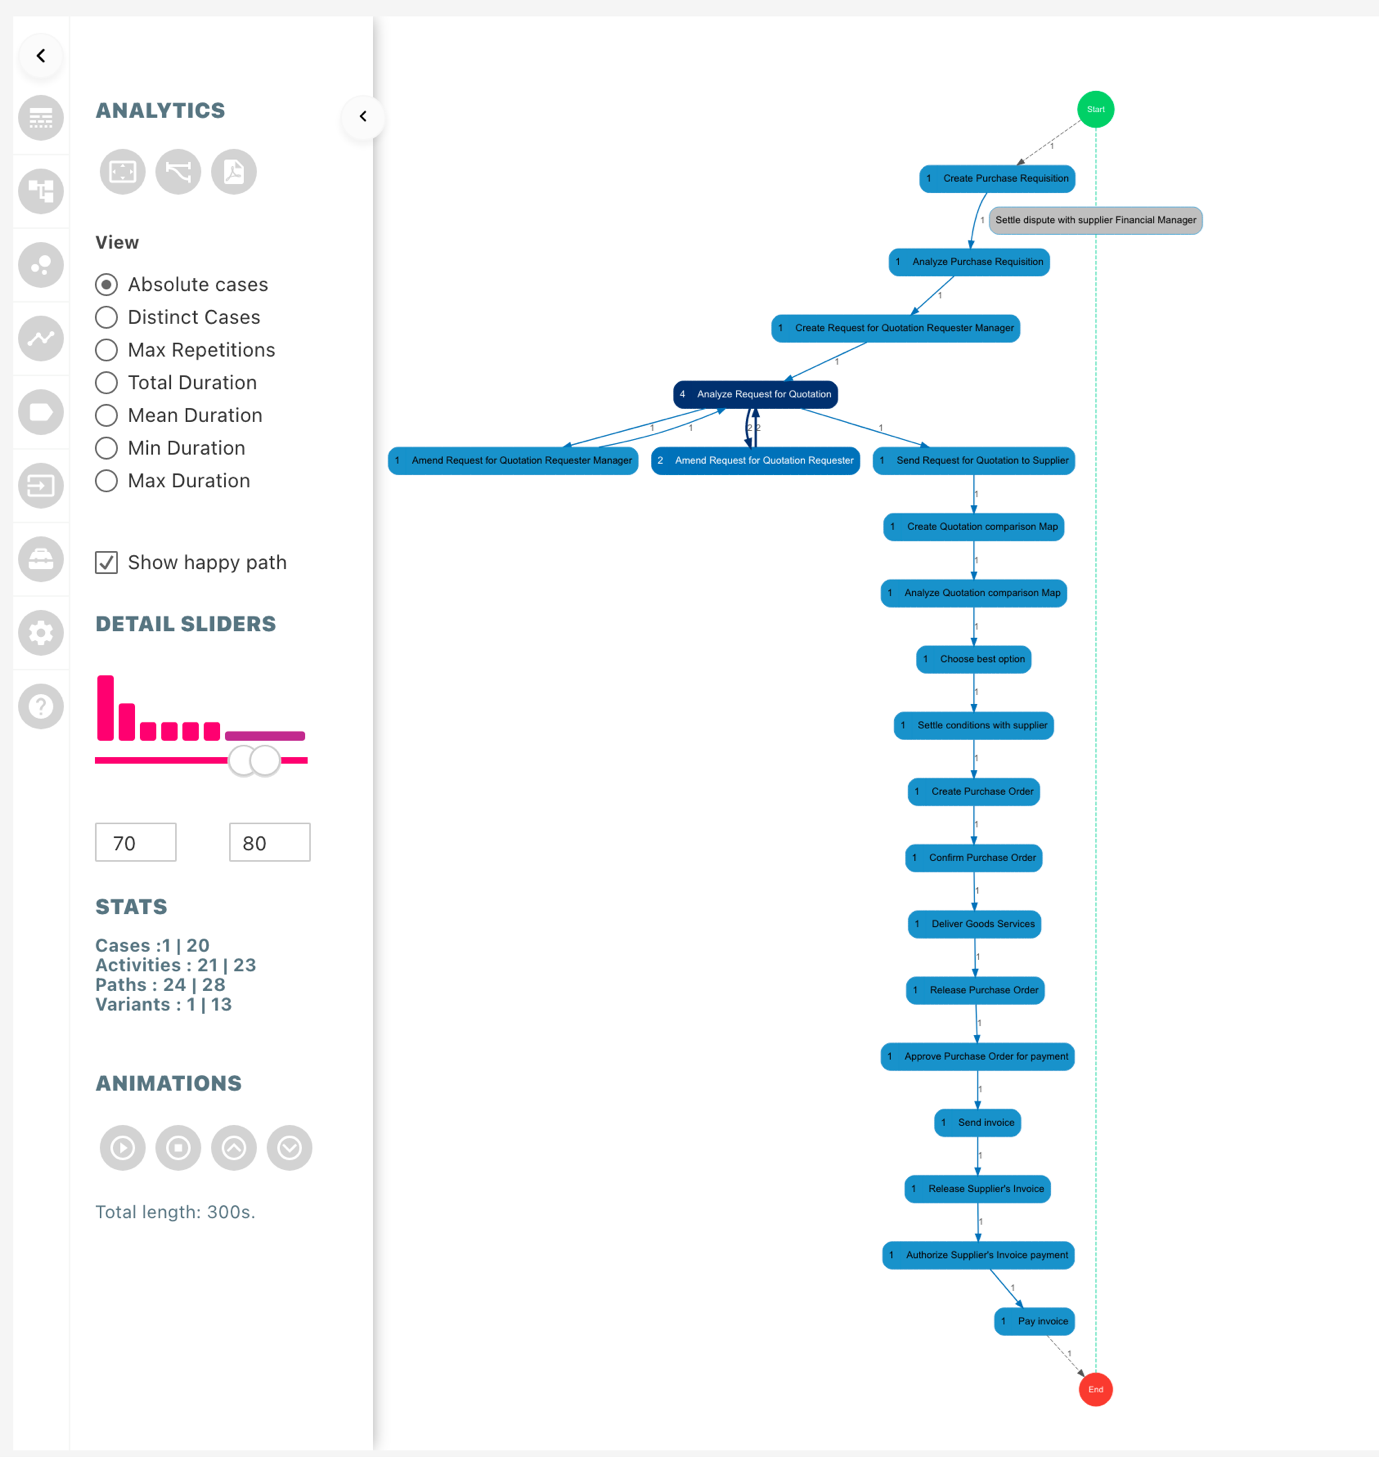
Detail slider, based on variants, allows the user to understand the flow of the process better. It lets the user focus on the most occurring or least occurring processes to understand and optimize the process flow. The histogram associated with the slider represents the overall distribution of variants, height of the bar represents the total number cases in the respective bucket. The distribution is based on buckets (for example if there are 100 cases then first 10 cases will be in the first bin). The text boxes below the histogram can be used to manually enter the range the user wants to focus on.
The variant slider can also be used as a filter to change the focus of your whole dashboard to variants in selected range. The configuration is the same as the variant filter available in dashboard actions pane. The same configuration responds to the filter in variants pane.
Stats
Content of the stats section represents what is shown in the process map, the values represent “current count | total count”.
Happy paths with detail slider
While moving the detail slider, if the nodes configured in the happy path is not available in the filtered path, then the nodes in the happy path will change color to grey without any value associated to it. In this way it is easy to analyze the process map and check if certain process skip important steps or following the structure.
Last updated
Was this helpful?