
Analytics tab
In the analytics tab you will have full control of what analytics options are shown with your process mining interface for dashboard users. Enable and disable analytics, variants, printing and animations etc.
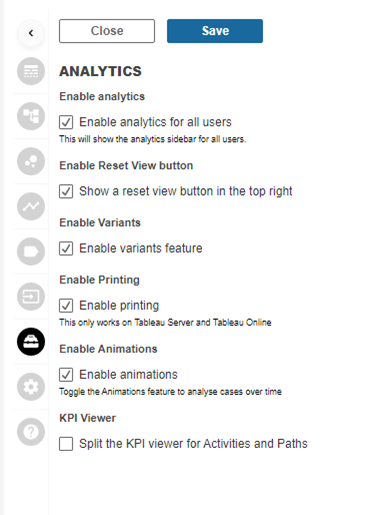
Enable analytics for all users
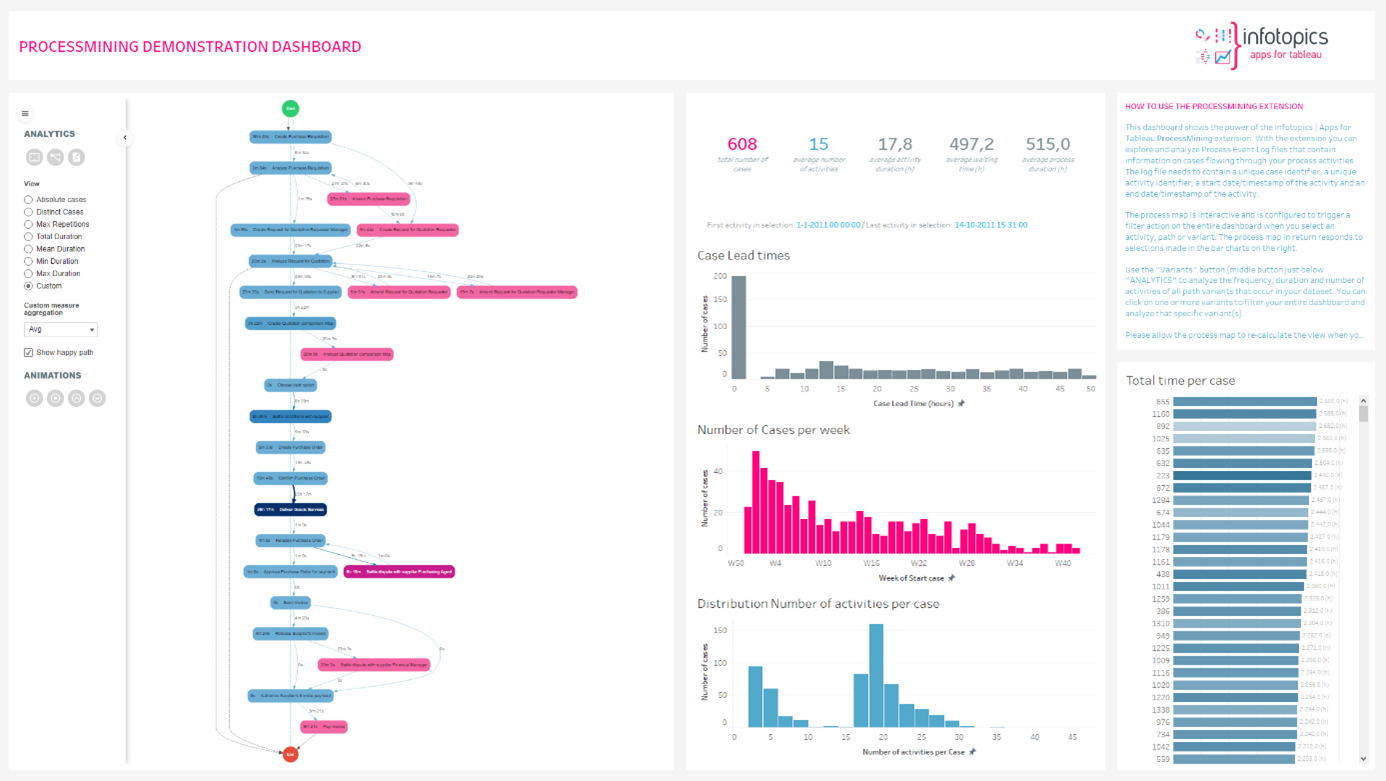
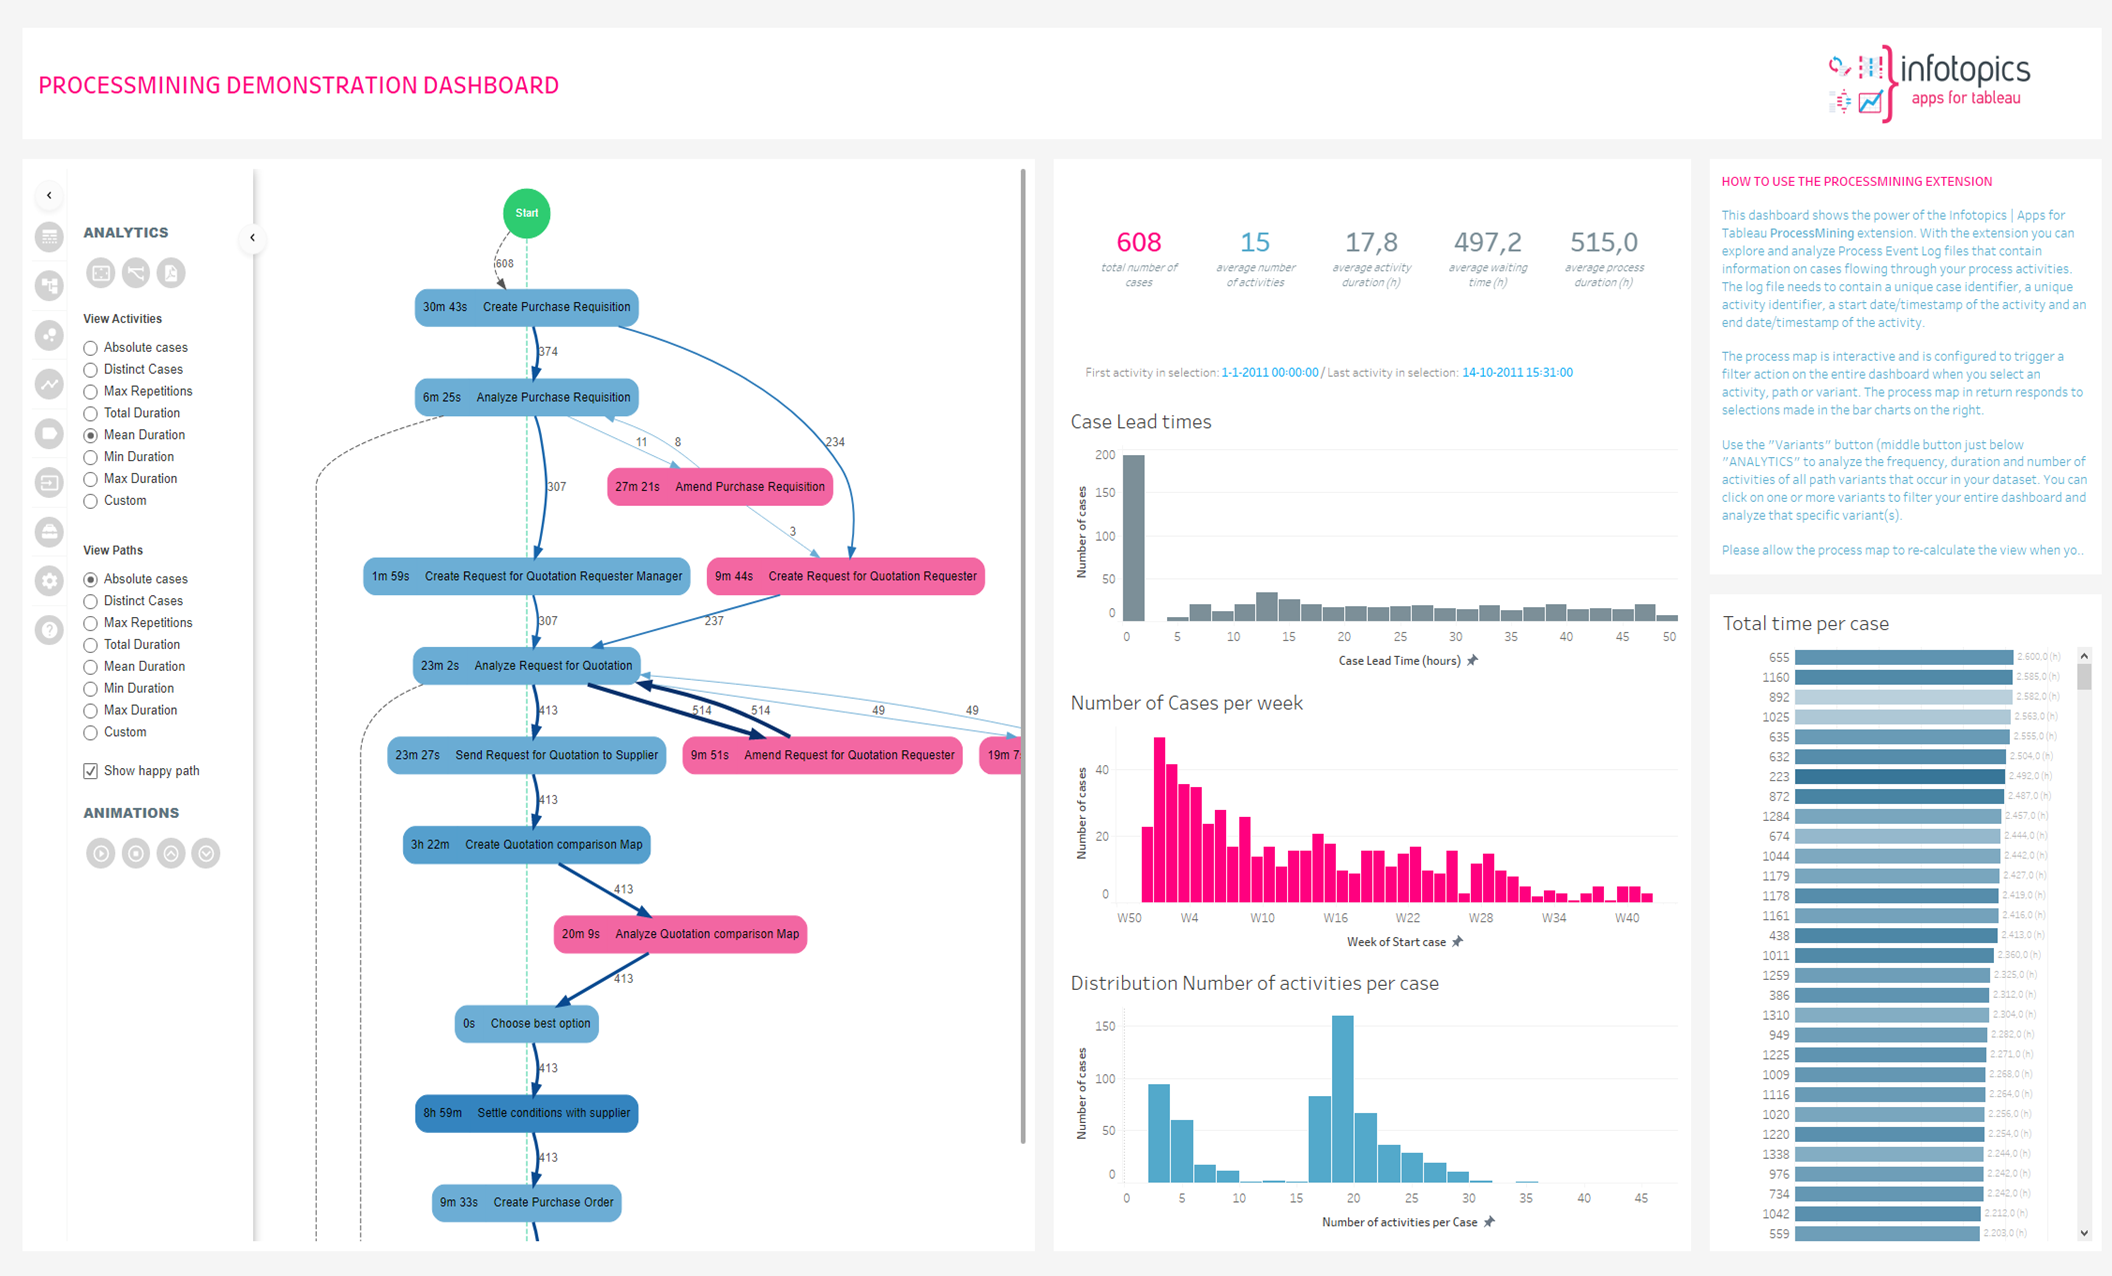
This is the “Main Switch” to enable or disable the analytics pane for your dashboard users. The analytics pane is the left sidebar shown in the screenshot below.
Enable reset view button
This enables the automatic resize view button that allows dashboard users to zoom to the ddefault format of the process map.
Enable variants
This will enable/disable the button to show the Variant Analysis screen where all variants are shown with different KPI’s as bar charts. With the button disabled Dashboard users can never access the Varaint screen.
Enable printing
Tableau Server and Tableau Online do not support the printing/exporting of web elements. That is why we have integrated a printing button that allows you to export your Process Map to a PDF file. With this switch you can aneable/disable the showing of the print button for dashboard users.
Enable animations
The ProcessMining extension supports animations of cases flowing through your process (End Date/Timestamp is required). This option enables or disables the option to play animations for dashboard users.
KPI viewer
This option allows Dashboard users to select different KPI’s for activities and Paths independently. An example is shown in the screenshot below where the activities show the mean duration and the paths show the number of hops
Last updated
Was this helpful?