Configuration Wizard
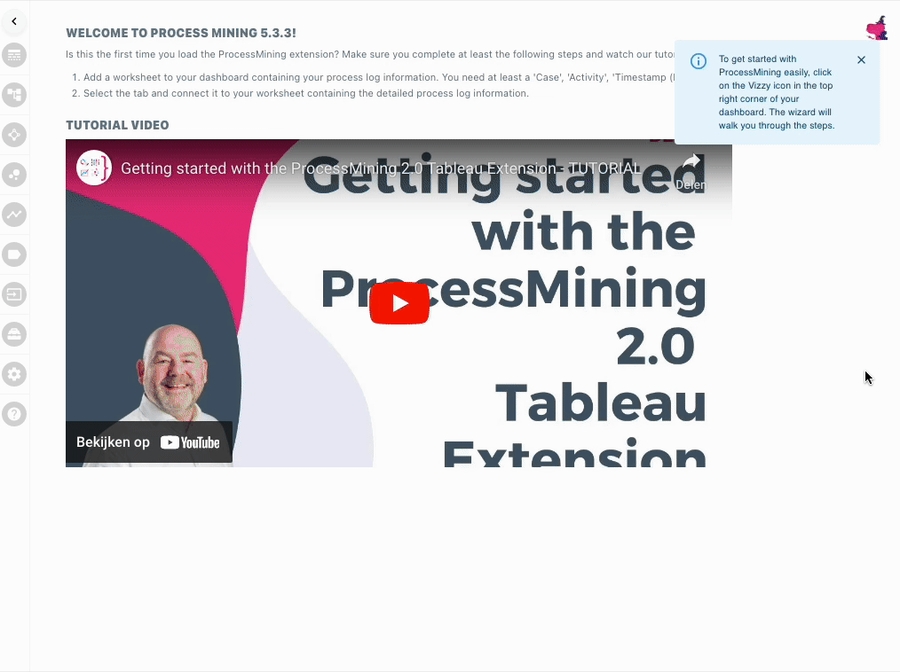
When adding the ProcessMining extension to a dashboard, it will open the configuration wizard by default. This wizard will take you through the initial steps of configuration:
Configuring the datasheet and (optionally) limiting data for testing purposes
Assigning the “Activity”, “Case Identifier”, “Start time” and optionally the “End time” and “Custom measure” roles to the relevant data from the data source
Initial configuration of the color, shapes and layout of the Process Mining visualisation
Alternatively, you can follow the steps below to configure the extensions manually, and in more detail.
Configure the ProcessMining extension
This chapter will explain the steps that need to be taken to get your ProcessMining extension up and running in your dashboard. First step is to open the
First make sure your configuration menu is visible. The top-left corner of the ProcessMining container sometimes shows a hamburger menu Click this hamburger menu because we need to access the configuration menu. You should see a menu bar on the left side of the ProcessMining container looking somewhat like the image shown to the right.
With this set of icons/menu options we will configure the ProcessMining extension.

Last updated
