ShowMeMore
WebsiteAll products
  • Introduction
    • Getting started with ShowMeMore
      • Guide to the first VizExtension
      • Getting started with dashboard extension
  • Visualization Types
  • Sankey Diagram
    • Data strucuture
    • Configuration Screen
    • Format
    • Color formatting
      • Text and background
      • Color Nodes
      • Color Links
    • Text formatting
      • Labels
      • Tooltips
      • Measures
    • Legend
    • Dashboard Actions
  • Source Target Sankey Diagram
    • Data strucuture
    • Configuration Screen
    • Format
    • Color formatting
      • Text and background
      • Color Nodes
      • Color Links
    • Text formatting
      • Labels
      • Tooltips
      • Measures
    • Dashboard Actions
  • Waterfall Chart
    • Data structure
    • Configuration Screen
    • Format
    • Labels
    • Measures
    • Color
    • Dashboard Actions
  • Geo Sankey Diagram
    • Data structure
    • Configuration Screen
    • Format
    • Tooltips
    • Labels
    • Dashboard Actions
    • Color
  • Network Diagram 2.0
    • Data structure
    • Configuration Screen
    • Analytics Options
    • Labels
    • Tooltip
    • Measures
    • Color
    • Format
    • Dashboard Actions
  • Radar Chart
    • Data structure
    • Configuration Screen
    • Format
    • Labels
    • Tooltips
    • Measures
    • Color
    • Legend
    • Dashboard Actions
  • Venn Diagram
    • Data structure
    • Configuration Screen
    • Format
    • Color
    • Labels
    • Tooltips
    • Measures
    • Legend
    • Dashboard Actions
  • Sunburst New Diagram
    • Data structure
    • Configuration Screen
    • Format
    • Tooltips
    • Measures
    • Labels
    • Color
    • Legend
    • Dashboard Actions
  • Sunburst diagram
    • Data structure
    • Configuration Screen
    • Format
    • Tooltips
    • Measures
    • Labels
    • Color
    • Legend
  • Chord Diagram
    • Data structure
    • Configuration Screen
    • Format
    • Color
    • Tooltips
    • Measures
    • Labels
    • Legend
    • Dashboard Actions
  • Circular Sankey Diagram
    • Data structure
    • Configuration Screen
    • Format
    • Tooltips
    • Measures
    • Labels
    • Dashboard Actions
    • Color
    • Legend
  • Ridgeline Plot
    • Data strucutre
    • Configuration Screen
    • Format
    • Color
    • Tooltips
    • Labels
    • Dashboard Actions
  • Horizon Chart
    • Data structure
    • Configuration Screen
    • Format
    • Labels
    • Color
    • Labels
  • Organization Chart
    • Data structure
    • Configuration Screen
    • Format
    • Color
    • Tooltips
    • Measures
    • Labels
    • Dashboard Actions
  • Calendar Chart
    • Configuration Screen
    • Labels
    • Measures
    • Color
    • Format
  • Network Diagram
  • Export Visualization
  • Troubleshot
    • Sankey Diagram crashes or fails to load
  • FAQ
    • Is the Waterfall Chart built directly from the data, or do I need custom calculations?
Powered by GitBook
On this page
  • Size Node
  • Strength (Force nodes to separate)
  • Node Distance
  • Node Size
  • Link Size
  • Number of iterations when animations are disabled
  • Node/Link Opacity
  • Border Width & Opacity
  • Show Labels
  • Default Zoom Level
  • Show Image As
  • New Shape
  1. Network Diagram 2.0

Format

PreviousColorNextDashboard Actions

Last updated 9 months ago

Arrows

Arrows will show the direction of source to target. Enable or disable here. This may help with the direction of the link between each of the nodes.

Size Node

Decide whether the incoming or outbound values will size your node. For example it may be important to see how many employees report to a manager, here you would choose incoming values.

Strength (Force nodes to separate)

Force nodes to separate to ensure better visibility and clarity within the network diagram. Adjust accordingly to manage the cohesion and distribution of nodes.

Node Distance

Change the distance from one node to another using the scroll bar. 300 is the biggest distance.

Node Size

Increase or decrease the size of your nodes, with 1 being the smallest & 5 the largest. All nodes will change in proportion. With less nodes available it may be beneficial to increase their size.

Link Size

Increase or decrease the width of your link, with 1 being the smallest & 5 the largest. Increase the stroke size to show clearer links.

Number of iterations when animations are disabled

Decide on how many iterations there will be when disabled. The iterations will help with the look by avoiding overlaps for example. To improve the performance try reducing the iterations.

Node/Link Opacity

Use the sliders to change the opacity of the Nodes and Links separately. Having a more transparent link will give a clearer view from your source to your target.

Border Width & Opacity

Change the style of your borders here by changing the width and opacity of the border. Style your nodes exactly how you want them.

Show Labels

Have labels shown always in your view, only when selected or always hidden, Labels give users more insight to what they’re seeing but it may not always be of use to have them in the viz at all times. Use the ‘Label Y Offset’ to change the position of the label.

Default Zoom Level

Some Network Diagrams may contain a large number of members. Change the default zoom level to ensure no members get cut off.

Show Image As

Choose from the many options to decide how you wish to see your URL image in the Network Diagram. Follow our GIF to see how the options affect our Network Diagram.

New Shape

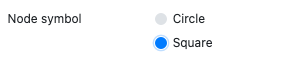
Change the shape of your nodes in your Network Diagram. Choose from circles or squares with coloured borders or not. A new look to your dashboard is controlled by the dashboard creator. Plenty of options to format these nodes by adding a border or just changing the shape.

Position groups in quadrants

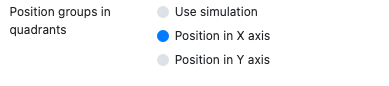
This option lets you choose different positioning types in your network diagram.

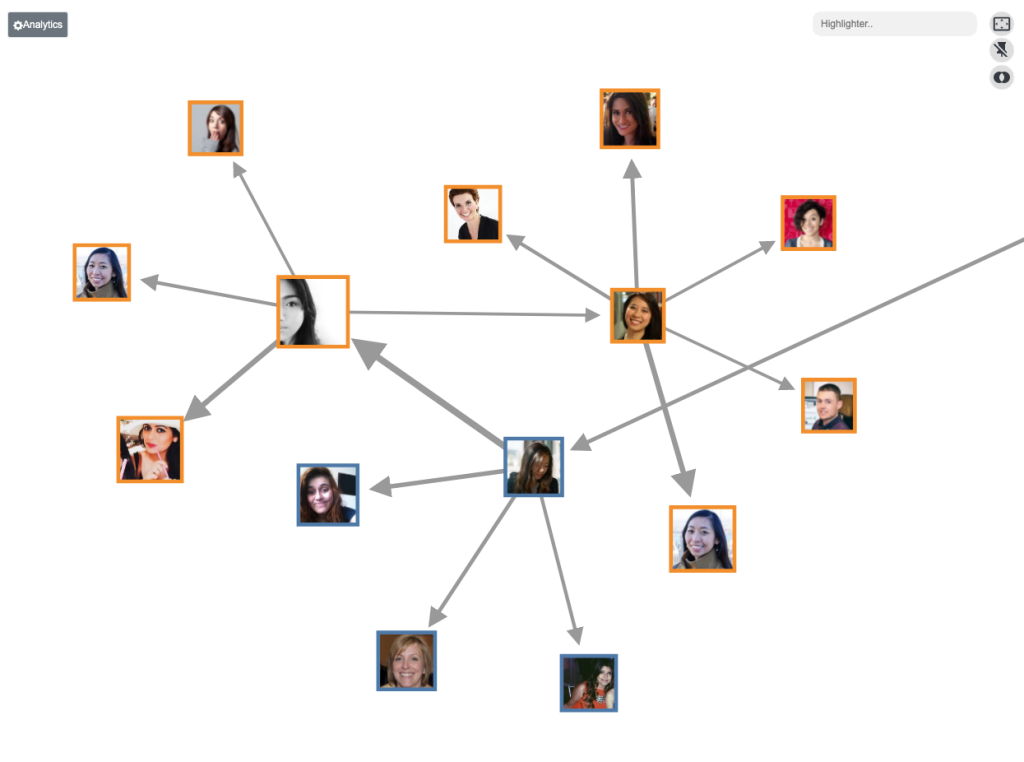
  • Position on X-axis will expand the network diagram on the x-axis, and group attributes will be used to decide the order of nodes.

  • Similarly, position on Y-axis will expand the network diagram on the y-axis

ShowMeMore Vizzes Guide showmemore