> For the complete documentation index, see [llms.txt](https://docs.infotopics.com/llms.txt). Markdown versions of documentation pages are available by appending `.md` to page URLs; this page is available as [Markdown](https://docs.infotopics.com/showmemore/features/network-diagram-2.0/format.md).
# Format
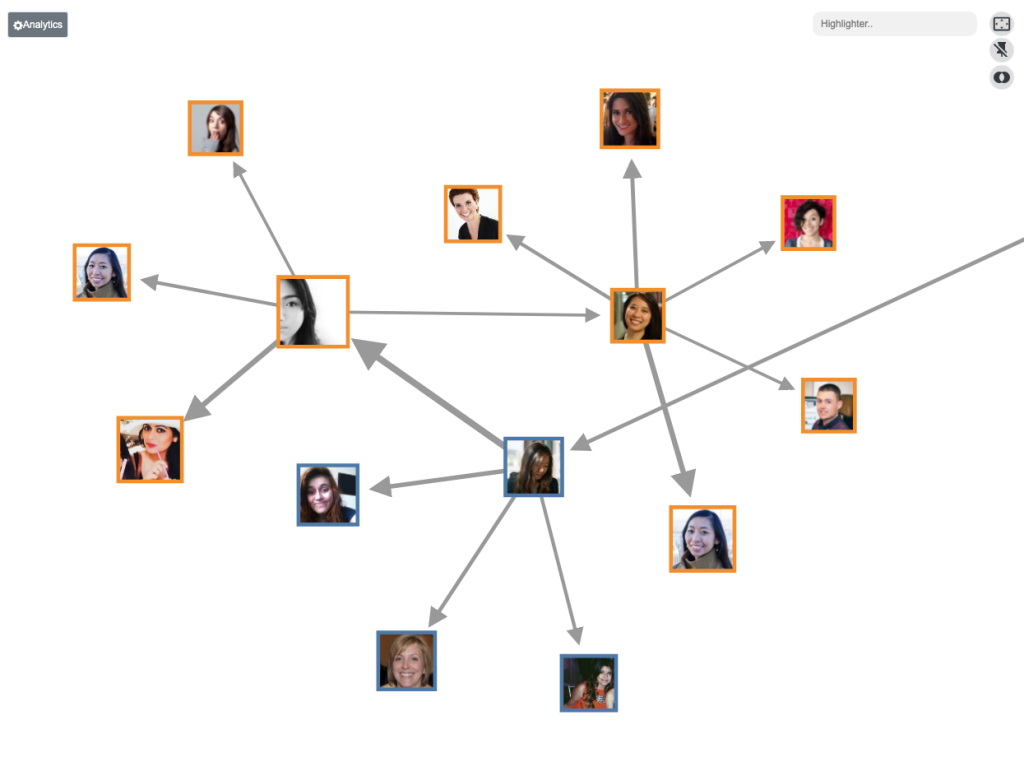
Arrows
Arrows will show the direction of source to target. Enable or disable here. This may help with the direction of the link between each of the nodes.
### Size node
Decide whether the incoming or outbound values will size your node. For example it may be important to see how many employees report to a manager, here you would choose incoming values.
### Strength (Force nodes to separate)
Force nodes to separate to ensure better visibility and clarity within the network diagram. Adjust accordingly to manage the cohesion and distribution of nodes.
### Node distance
Change the distance from one node to another using the scroll bar. 300 is the biggest distance.
### Node size
Increase or decrease the size of your nodes, with 1 being the smallest & 5 the largest. All nodes will change in proportion. With less nodes available it may be beneficial to increase their size.
### Link size
Increase or decrease the width of your link, with 1 being the smallest & 5 the largest. Increase the stroke size to show clearer links.
### Number of iterations when animations are disabled
Decide on how many iterations there will be when disabled. The iterations will help with the look by avoiding overlaps for example. To improve the performance try reducing the iterations.
### Node/Link opacity
Use the sliders to change the opacity of the Nodes and Links separately. Having a more transparent link will give a clearer view from your source to your target.
### Border width & opacity
Change the style of your borders here by changing the width and opacity of the border. Style your nodes exactly how you want them.
### Show labels
Have labels shown always in your view, only when selected or always hidden, Labels give users more insight to what they’re seeing but it may not always be of use to have them in the viz at all times. Use the ‘Label Y Offset’ to change the position of the label.
### Default zoom level
Some Network Diagrams may contain a large number of members. Change the default zoom level to ensure no members get cut off.
### Show image as
Choose from the many options to decide how you wish to see your URL image in the Network Diagram. Follow our GIF to see how the options affect our Network Diagram.
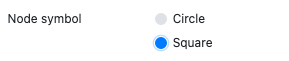
### New shape
Change the shape of your nodes in your Network Diagram. Choose from circles or squares with coloured borders or not. A new look to your dashboard is controlled by the dashboard creator. Plenty of options to format these nodes by adding a border or just changing the shape.
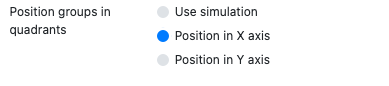
#### **Position groups in quadrants**
This option lets you choose different positioning types in your network diagram.
* Position on X-axis will expand the network diagram on the x-axis, and group attributes will be used to decide the order of nodes.
* Similarly, position on Y-axis will expand the network diagram on the y-axis
{% tabs %}
{% tab title="Align Nodes In Y-axis" %}
{% endtab %}
{% tab title="Align Nodes In X-axis" %}
{% endtab %}
{% endtabs %}
---
# Agent Instructions
This documentation is published with GitBook. GitBook is the documentation platform designed so that both humans and AI agents can read, navigate, and reason over technical content effectively. Learn more at gitbook.com.
## Querying This Documentation
If you need additional information that is not directly available in this page, you can query the documentation dynamically by asking a question.
Perform an HTTP GET request on the current page URL with the `ask` query parameter, and the optional `goal` query parameter:
```
GET https://docs.infotopics.com/showmemore/features/network-diagram-2.0/format.md?ask=&goal=
```
`ask` is the immediate question: it should be specific, self-contained, and written in natural language.
`goal` is optional and describes the broader end goal you are ultimately trying to accomplish on behalf of the user. GitBook uses it to tailor the answer towards what is most useful for that goal.
The response will contain a direct answer to the question and relevant excerpts and sources from the documentation.
Use this mechanism when the answer is not explicitly present in the current page, you need clarification or additional context, or you want to retrieve related documentation sections.
 This option lets you choose different positioning types in your network diagram.
* Position on X-axis will expand the network diagram on the x-axis, and group attributes will be used to decide the order of nodes.
* Similarly, position on Y-axis will expand the network diagram on the y-axis
{% tabs %}
{% tab title="Align Nodes In Y-axis" %}
This option lets you choose different positioning types in your network diagram.
* Position on X-axis will expand the network diagram on the x-axis, and group attributes will be used to decide the order of nodes.
* Similarly, position on Y-axis will expand the network diagram on the y-axis
{% tabs %}
{% tab title="Align Nodes In Y-axis" %}