> For the complete documentation index, see [llms.txt](https://docs.infotopics.com/llms.txt). Markdown versions of documentation pages are available by appending `.md` to page URLs; this page is available as [Markdown](https://docs.infotopics.com/showmemore/features/network-diagram-2.0/analytics-options.md).
# Analytics options
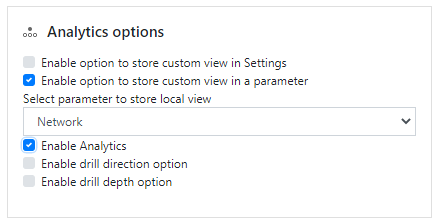
Store Custom Views! Network Diagram allows dashboard creators to store their custom view in their workbook settings or within a Tableau parameter.
**Custom view in settings**
When activating storing custom view in settings, you will notice a save symbol appear on your viz. Save your diagram in your workbook settings once you’ve got it looking how you desired. Once saved this will be the default view every time you open your workbook, until you save again.
**Custom view in a parameter**
When choosing this option make sure you have a dedicated parameter created! Create a parameter of type string and name it so it’s recognizable when configuring here! Connect to your parameter, now all changes will be stored without having to save.
When any changes to the viz are changed, they’ll be automatically saved to the parameter, if you wish to wipe the slate clean and start afresh you will see the unpin symbol, click here to reset your view.
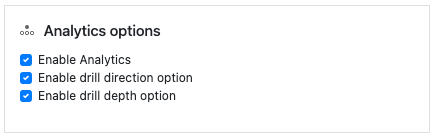
#### Enable analytics
**Enable drill direction option**
Here you can specify the drill direction. Drill direction determines the path the drill through action will take. The default is both ways. If you want to drill through the data in a different direction, you can change the drill direction here ( Available options are inward, outward and both ways)
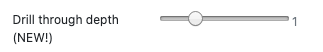
**Enable drill depth option**
Here you can set the depth of your drill action, the depth determines how far your drill through action travels down the network diagram.
### **Analytics**
The Network diagram 2.0 offers multiple features to analyse the network diagram like a highlighter and a drill through.
#### Highlighter
A fantastic new feature has dropped with our highlighter! In the top right corner, you can see the highlighter feature which you can use to highlight the nodes and links through a text search bar. Simply typing the name will highlight the node along with the connecting links. In a busy viz the highlighter will allow users to highlight their intended node whilst staying in the flow.
**Drill-through**
The Drill through feature allows you to navigate your data in an interactive way. The feature will enable you to visualize more detailed information within the network diagram. Drill through analysis is often confused with drill-down analysis as both practices are very similar. But, there is one main factor that makes them different. While drilling down provides granular information ( ) within a specific chart or data set, however, drill throughs display another aspect of the data that might be relevant.
Network Diagram 2.0 offers two options to select the drill level and drill direction. The drill level defines how far your drill action propagates from the selected node. Drill direction defines in which direction you want the drill action to propagate; inward, outward, or both. For example, as the name suggests, the “inward” option highlights the nodes and paths which are coming to the selected node, and “outward” highlights the opposite.
Drill through analysis lets you see data from different points of view and navigate through data, and analyze it with different options. This greatly enhances the users’ understanding of the data and of the reasons behind the figures.
The drill through option can be used in two ways, one by setting a default configuration where the user will only be able to drill through a predefined direction and depth. Two, using the analytics pane where the user can change the drill direction and drill depth and explore the network.
{% tabs %}
{% tab title="Configuration" %}
Drill level lets you choose how far your drill action should propagate. level zero means it only highlights the nodes which are directly linked to the selected node. Level one means the action highlights the nodes that are connected to the nodes which are immediately connected to the selected nodes. An increase in level makes its action travel further from the selected node.
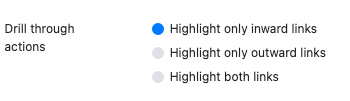
There are three highlight options available.
1. Highlight only inward links: Highlights the links which are coming towards the selected node (incoming).
2. Highlight only outward links: Highlights the links which are going from the selected node (outgoing).
3. Highlight both: Highlights both incoming and outgoing nodes.
{% endtab %}
{% tab title="Enable analytics pane" %}
\
This section will let you configure the analytics pane, for both drill depth and drill direction, the default option will be set from the value the user configures in the configuration pane.
{% endtab %}
{% endtabs %}
#### **Drill through actions**
{% tabs %}
{% tab title="Drill direction" %}
{% endtab %}
{% tab title="Drill depth" %}
{% endtab %}
{% endtabs %}
---
# Agent Instructions
This documentation is published with GitBook. GitBook is the documentation platform designed so that both humans and AI agents can read, navigate, and reason over technical content effectively. Learn more at gitbook.com.
## Querying This Documentation
If you need additional information that is not directly available in this page, you can query the documentation dynamically by asking a question.
Perform an HTTP GET request on the current page URL with the `ask` query parameter, and the optional `goal` query parameter:
```
GET https://docs.infotopics.com/showmemore/features/network-diagram-2.0/analytics-options.md?ask=&goal=
```
`ask` is the immediate question: it should be specific, self-contained, and written in natural language.
`goal` is optional and describes the broader end goal you are ultimately trying to accomplish on behalf of the user. GitBook uses it to tailor the answer towards what is most useful for that goal.
The response will contain a direct answer to the question and relevant excerpts and sources from the documentation.
Use this mechanism when the answer is not explicitly present in the current page, you need clarification or additional context, or you want to retrieve related documentation sections.