
Parameter action
A parameter action within your story will load the sheet targeted within your parameter. First, let's set up a parameter to link to. Within your worksheet create a parameter, see our example of how we set up one of ours.
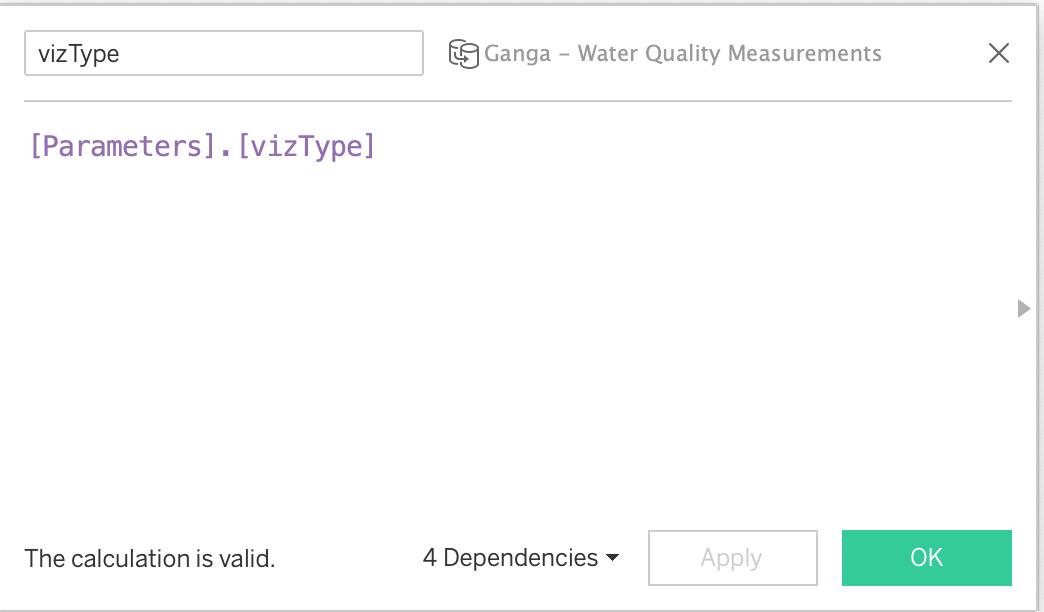
Step 1 – Create your parameter. Name it so it’s easily identifiable in which parameter you wish to use.
Step 2 – Create a boolean calculation using the parameter to hide or show the container, use the calculation as a filter.
Step 3 – Link to parameter when setting up your parameter action. Choose a parameter from the dropdown menu, select the parameter you just created and finally change the parameter value to the one chosen in the filter.
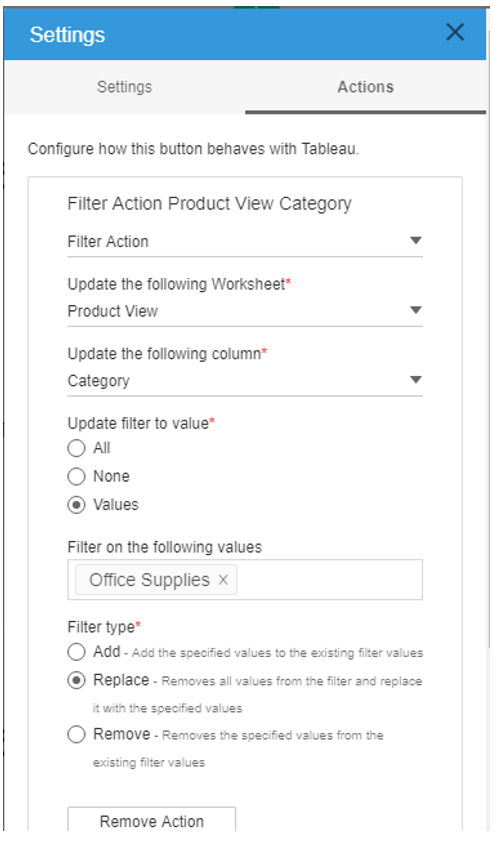
Filter action
Similarly, you can configure the filter actions to only one value. When telling your story it may be important to show all the data and then be able to filter down on a particular dimension to be able to explain in more detail.
To set up a filter action, head to the settings within ScrollyTelling and choose Filter Action from the first dropdown. Select your worksheet where the filter is stored and then the column you wish to filter on.
Update the filter to value will allow you to show all values, none or to filter the values you choose by clicking on the ‘Filter on the following values’ box
Filter animation
Filter actions trigger a predefined filter to the dashboard. You can configure the same as the parameter configuration. Animations are basically a way to trigger a set of filters with a prespecified time interval. In the configuration pane, you can list This could be a cool feature to show in your story if you’re comparing data over time for example. For example, the GIF below shows filter animations for 4 years.
The configuration is very simple and straightforward. To set up a filter animation, head to the settings within ScrollyTelling and choose Filter Animation from the first dropdown. Select your worksheet where the filter is stored and then the column you wish to filter on.

In the configuration pane, you can configure how your filter animations should work. Once you select the sheet and the column you want to apply a filter on, then you can select the values which the filter should loop through.
Filter type: Here you can choose the type of filter action, which works similar to the filter actions in Tableau.
Add – Add the specified values to the existing filter values, this will keep values displayed in the visual.
Replace – Removes all values from the filter and replaces them with the specified values.
Remove – Removes the specified values from the existing filter values.
When the animation starts: A cool feature where you can decide to exclude all before the animation starts. This will show a clear view before the animation starts. Below you will be able to choose what is shown once the animation is finished.
Do Nothing: Does not apply any filters
Exclude all: Excludes the specified filters
Show all: Shows viz with all the filters.
When animation is finished: Here you can specify what happens when the animation is finished.
Do Nothing: Stops the animation and leaves the filters the last applied the filter
Exclude all: Removes all applied filters
Show all: Applies all the filters.
Interval in milliseconds: Type how long in milliseconds each filter action shall take in the text box.
Parameter animation
Parameter animation can be used to trigger parameter value changes similar to filter actions and animations. One good use case is using parameter to hide or show containers on scroll.
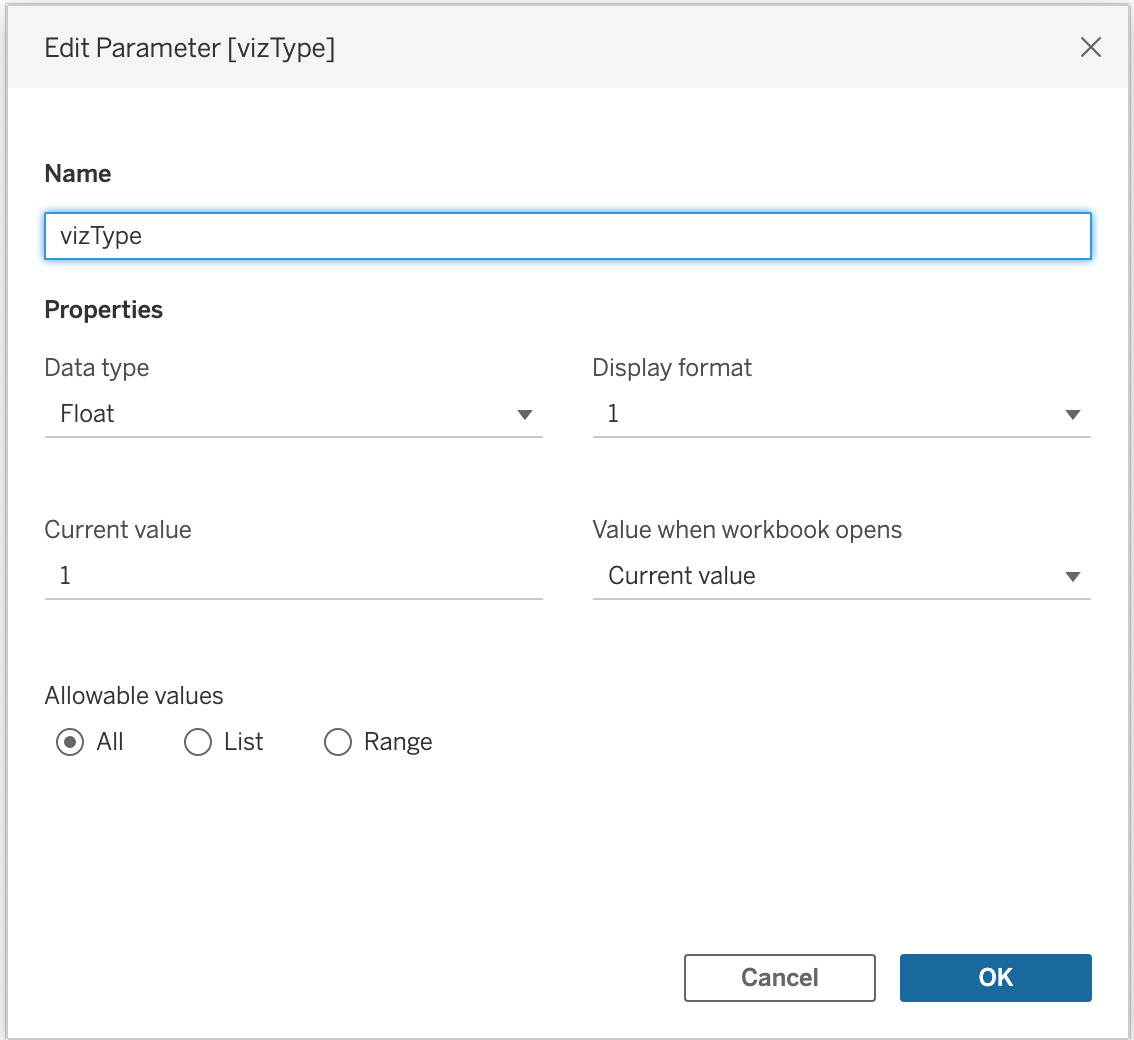
Setting up a parameter – Within your data worksheet right click in the left pane and choose ‘Create Parameter’
Here you will be able to edit your parameter. Choose the data type that correlates to the names of your sheets. Our example sheets are numbered so have set ours as an Integer data type.
To set up a parameter animation button, go to the settings of your button using the hamburger menu. Choose the Parameter Animation from the dropdown as well as your parameter. Enter the names of the sheets you wish to be animated using a comma to separate. Lastly decide in MS how long the intervals should be between each animation.
Highlight action and animation
Highlight areas of your story using the configurable highlight animation tableau action. It highlights certain areas that need the listeners to focus on. Have multiple areas highlighted in a sequence chosen at the speed you determine.
In the configuration menu, you can choose the worksheet and column you wish to apply the highlight on. Similar to tableau you can choose options like highlight 'none' or 'values'. if you select values then you can specify the value you wish to highlight. In the next step you can choose the highlight type and the options are the same as how you configure it in tableau.
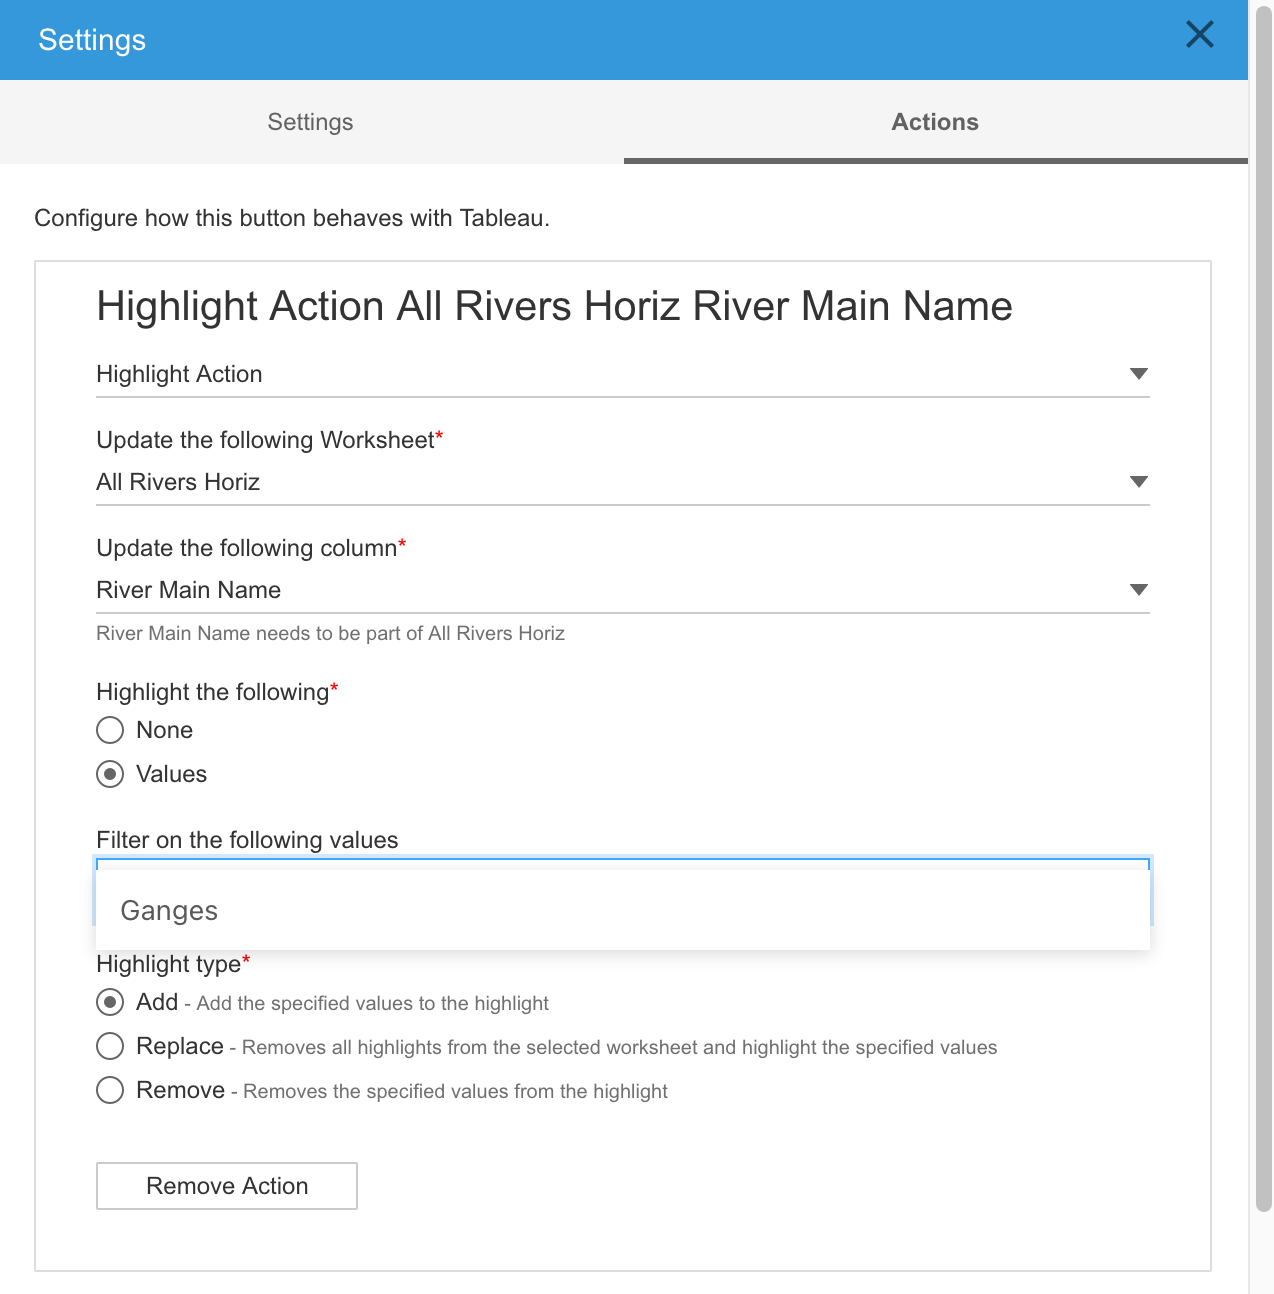
‘Loop over the following values’ is where you decide which values from your chosen column you wish to highlight on. Click within the box to choose your value(s) Decide if you wish to leave the highlighted values or tick the box to clear once the animation finishes. The interval per animation is in milliseconds which can be entered at the bottom.
ScrollyTelling in action.
This small tutorial will give you a better context on how to configure the tableau actions in ScrollyTelling. A combination of some native tableau tricks with ScrollyTelling unleashes a plethora of custom actions to make your dashboard amazing. For example, you can use parameter actions to switch between different visualizations in the dashboard. Here is a small tutorial on how to create a dashboard which changes the worksheet on scroll.
For reference on how the end product looks, you can download our demo workbook from the portal to see the tutorial in action. For this particular example, we use the tableau parameters to switch the visibility of the workbooks.
Prepare all the visualizations and tableau visualizations needed for the project and use a vertical container in the dashboard to hold all sheets.
Next, we need an object with resembles a page number. So create a tableau parameter with the datatype "int", and add it to the dashboard, make sure to set the default value as 1.
Create a calculated field and add the parameter to the calculated field. Create a Boolean like calculation (TRUE/FALSE) and make it show or hide the sheet (by adding the calculation as a filter)
Add the calculated field which you created in the previous step as a filter in the sheet. Under the general tab click on ‘Custom value list’ where you can enter the value below. This will be the page number you will need when setting up ScrollyTelling parameter actions to show and hide this sheet in the dashboard. Do this on each worksheet with a different value representing a different page in your story.
Now in the extension configuration, create a tableau action button with the "Parameter action option", then configure with the parameter you created and choose the page you want to be visible when you click on the tableau action button.
Repeat these steps for all sections and visualizations which you want to switch on scroll or action.

Last updated
Was this helpful?