ShowMeMore
WebsiteAll products
  • Introduction
    • Getting started with ShowMeMore
      • Guide to the first VizExtension
      • Getting started with dashboard extension
  • Visualization Types
  • Sankey Diagram
    • Data strucuture
    • Configuration Screen
    • Format
    • Color formatting
      • Text and background
      • Color Nodes
      • Color Links
    • Text formatting
      • Labels
      • Tooltips
      • Measures
    • Legend
    • Dashboard Actions
  • Source Target Sankey Diagram
    • Data strucuture
    • Configuration Screen
    • Format
    • Color formatting
      • Text and background
      • Color Nodes
      • Color Links
    • Text formatting
      • Labels
      • Tooltips
      • Measures
    • Dashboard Actions
  • Waterfall Chart
    • Data structure
    • Configuration Screen
    • Format
    • Labels
    • Measures
    • Color
    • Dashboard Actions
  • Geo Sankey Diagram
    • Data structure
    • Configuration Screen
    • Format
    • Tooltips
    • Labels
    • Dashboard Actions
    • Color
  • Network Diagram 2.0
    • Data structure
    • Configuration Screen
    • Analytics Options
    • Labels
    • Tooltip
    • Measures
    • Color
    • Format
    • Dashboard Actions
  • Radar Chart
    • Data structure
    • Configuration Screen
    • Format
    • Labels
    • Tooltips
    • Measures
    • Color
    • Legend
    • Dashboard Actions
  • Venn Diagram
    • Data structure
    • Configuration Screen
    • Format
    • Color
    • Labels
    • Tooltips
    • Measures
    • Legend
    • Dashboard Actions
  • Sunburst New Diagram
    • Data structure
    • Configuration Screen
    • Format
    • Tooltips
    • Measures
    • Labels
    • Color
    • Legend
    • Dashboard Actions
  • Sunburst diagram
    • Data structure
    • Configuration Screen
    • Format
    • Tooltips
    • Measures
    • Labels
    • Color
    • Legend
  • Chord Diagram
    • Data structure
    • Configuration Screen
    • Format
    • Color
    • Tooltips
    • Measures
    • Labels
    • Legend
    • Dashboard Actions
  • Circular Sankey Diagram
    • Data structure
    • Configuration Screen
    • Format
    • Tooltips
    • Measures
    • Labels
    • Dashboard Actions
    • Color
    • Legend
  • Ridgeline Plot
    • Data strucutre
    • Configuration Screen
    • Format
    • Color
    • Tooltips
    • Labels
    • Dashboard Actions
  • Horizon Chart
    • Data structure
    • Configuration Screen
    • Format
    • Labels
    • Color
    • Labels
  • Organization Chart
    • Data structure
    • Configuration Screen
    • Format
    • Color
    • Tooltips
    • Measures
    • Labels
    • Dashboard Actions
  • Calendar Chart
    • Configuration Screen
    • Labels
    • Measures
    • Color
    • Format
  • Network Diagram
  • Export Visualization
  • Troubleshot
    • Sankey Diagram crashes or fails to load
  • FAQ
    • Is the Waterfall Chart built directly from the data, or do I need custom calculations?
Powered by GitBook
On this page
  1. Geo Sankey Diagram

Format

PreviousConfiguration ScreenNextTooltips

Last updated 9 months ago

Geo Sankey allows for many formatting options, here we will explain what each one offers.

Maximum link width

If you were to have many links within your viz it may be a good idea to reduce the maximum width of the links. Use the slider to choose your ideal maximum width.

Maximum Node Radius

Set the maximum size for your nodes. If there’s a condensed area of nodes, these may overlap and you’ll not be able to get clear insight from the view. Reduce the radius using the slider.

Horizontal node padding

Change the padding between nodes horizontally here. This will help with the spacing between nodes preventing as much overlapping as possible.

Link/Node Opacity

Change the link and node opacity separately using the sliders. The lower the number the more transparent they’ll be.

Node Border

Enable or disable a border on your nodes.

Zoom Level

Set the level you wished to be zoomed when the Geo-Sankey reloads. If your data is focused in a small area, increase the zoom level.

Show Paths

An important change will be whether to show the links from nodes at all time or just when you click on your desired node. A great formatting option use for different use cases.
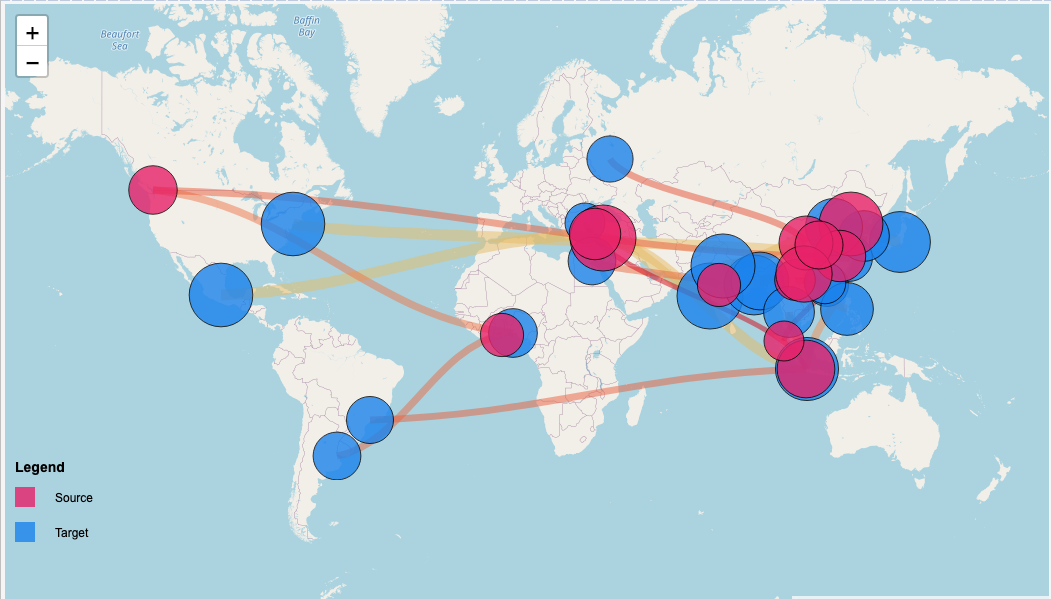
Legend

Add a legend to your viz to show your users what the colors represent by using a legend. The clearer your viz, the better the user experience will be.