> For the complete documentation index, see [llms.txt](https://docs.infotopics.com/llms.txt). Markdown versions of documentation pages are available by appending `.md` to page URLs; this page is available as [Markdown](https://docs.infotopics.com/showmemore/features/geo-sankey-diagram/format.md).
# Format
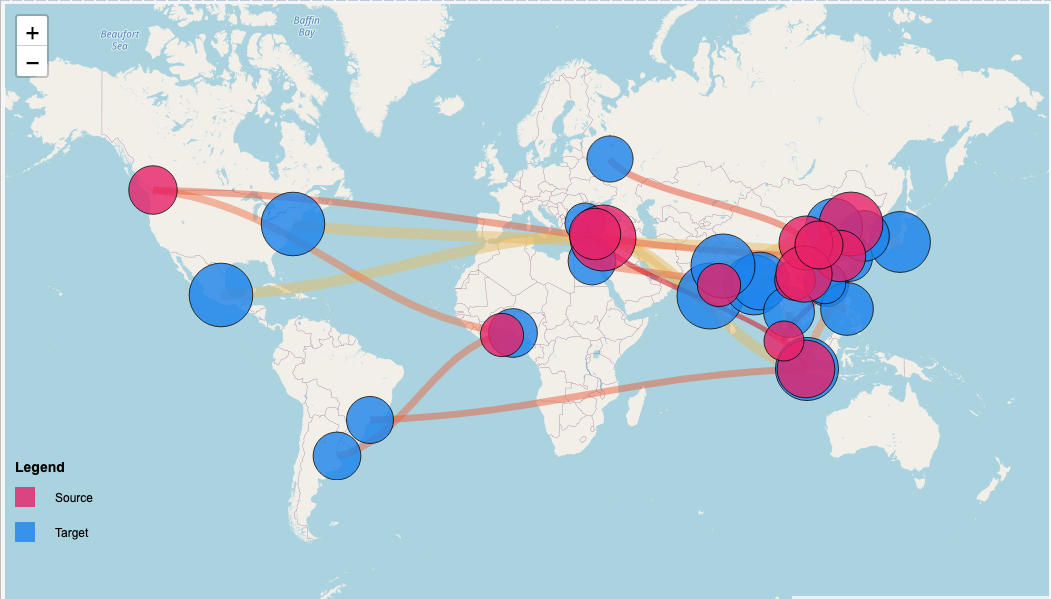
Geo Sankey allows for many formatting options, here we will explain what each one offers.
#### Maximum link width
If you were to have many links within your viz it may be a good idea to reduce the maximum width of the links. Use the slider to choose your ideal maximum width.
#### Maximum node radius
Set the maximum size for your nodes. If there’s a condensed area of nodes, these may overlap and you’ll not be able to get clear insight from the view. Reduce the radius using the slider.
#### Horizontal node padding
Change the padding between nodes horizontally here. This will help with the spacing between nodes preventing as much overlapping as possible.
#### Link/Node opacity
Change the link and node opacity separately using the sliders. The lower the number the more transparent they’ll be.
#### Node border
Enable or disable a border on your nodes.
#### Zoom level
Set the level you wished to be zoomed when the Geo-Sankey reloads. If your data is focused in a small area, increase the zoom level.
#### Show paths
An important change will be whether to show the links from nodes at all time or just when you click on your desired node. A great formatting option use for different use cases.
#### Legend
Add a legend to your viz to show your users what the colors represent by using a legend. The clearer your viz, the better the user experience will be.
---
# Agent Instructions
This documentation is published with GitBook. GitBook is the documentation platform designed so that both humans and AI agents can read, navigate, and reason over technical content effectively. Learn more at gitbook.com.
## Querying This Documentation
If you need additional information that is not directly available in this page, you can query the documentation dynamically by asking a question.
Perform an HTTP GET request on the current page URL with the `ask` query parameter, and the optional `goal` query parameter:
```
GET https://docs.infotopics.com/showmemore/features/geo-sankey-diagram/format.md?ask=&goal=
```
`ask` is the immediate question: it should be specific, self-contained, and written in natural language.
`goal` is optional and describes the broader end goal you are ultimately trying to accomplish on behalf of the user. GitBook uses it to tailor the answer towards what is most useful for that goal.
The response will contain a direct answer to the question and relevant excerpts and sources from the documentation.
Use this mechanism when the answer is not explicitly present in the current page, you need clarification or additional context, or you want to retrieve related documentation sections.