
Set-up dashboard extension
To set up the dashboard extension, we will need to create or use a datasheet with a recursive datastructure. The dataset at least needs two key columns. One for parent keys and one for child/row keys. The root of the tree needs to be a child key with a null value as its parent key. An empty cell in Tableau also works.
A label column can be added to show a name instead of the child key. The label on the same row of the child/row key will be shown.
Here is a small table of example data:
null
1
CEO
1
2
Manager 1
1
3
Manager 2
You can start a recursive tree by dragging dimensions or measures onto the Detail mark in the marks pane or on the rows/column shelves. After which, the datasheet might look like this.

After setting up the datasheet, we need to create a dashboard. On this dashboard we need to add the datasheet by dragging it onto the dashboard. Then, we need to import the HierarchyFilter by dragging a extension object onto the dashboard. Here we can select either the free version from the store, or the trex file from the "Acces Local Extensions" button.
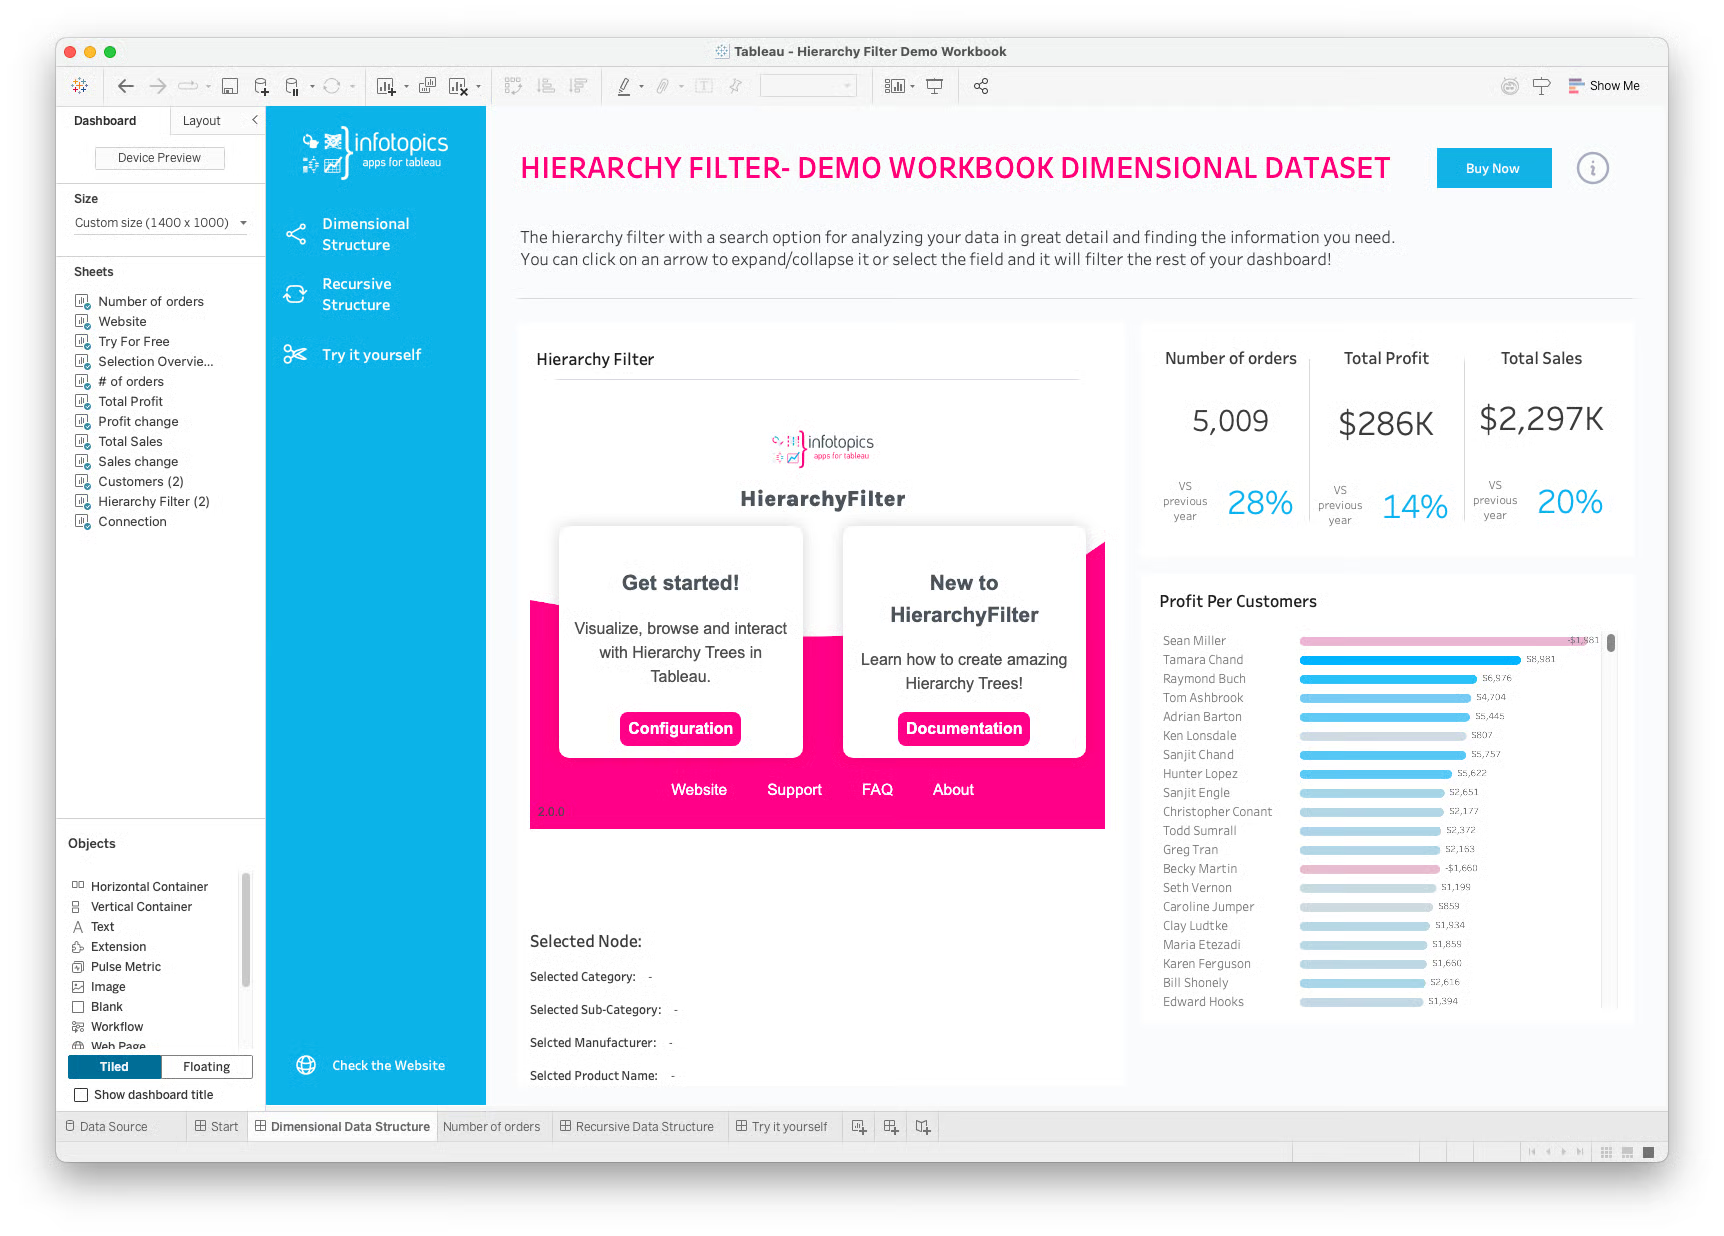
Here, we can add more Tableau visualizations to utilize the interactivity of the HierarchyFilter extension. To set up the tree, we need to click the "Configuration" button on the extension. Alternatively, select the container of the HierarchyFilter extension and from the dropdown context menu select “Configure”. After which a dialog window will pop up.

On the first page of the configuration, The "Recursive" block needs to be selected as seen above. After which, we can go to the next page.

On the second configuration page, we need to select the correct columns for the parent key, child key and label. The rest of the configuration is optional and can be skipped for now. for more information these options, go to the Configure the HierarchyFilter.
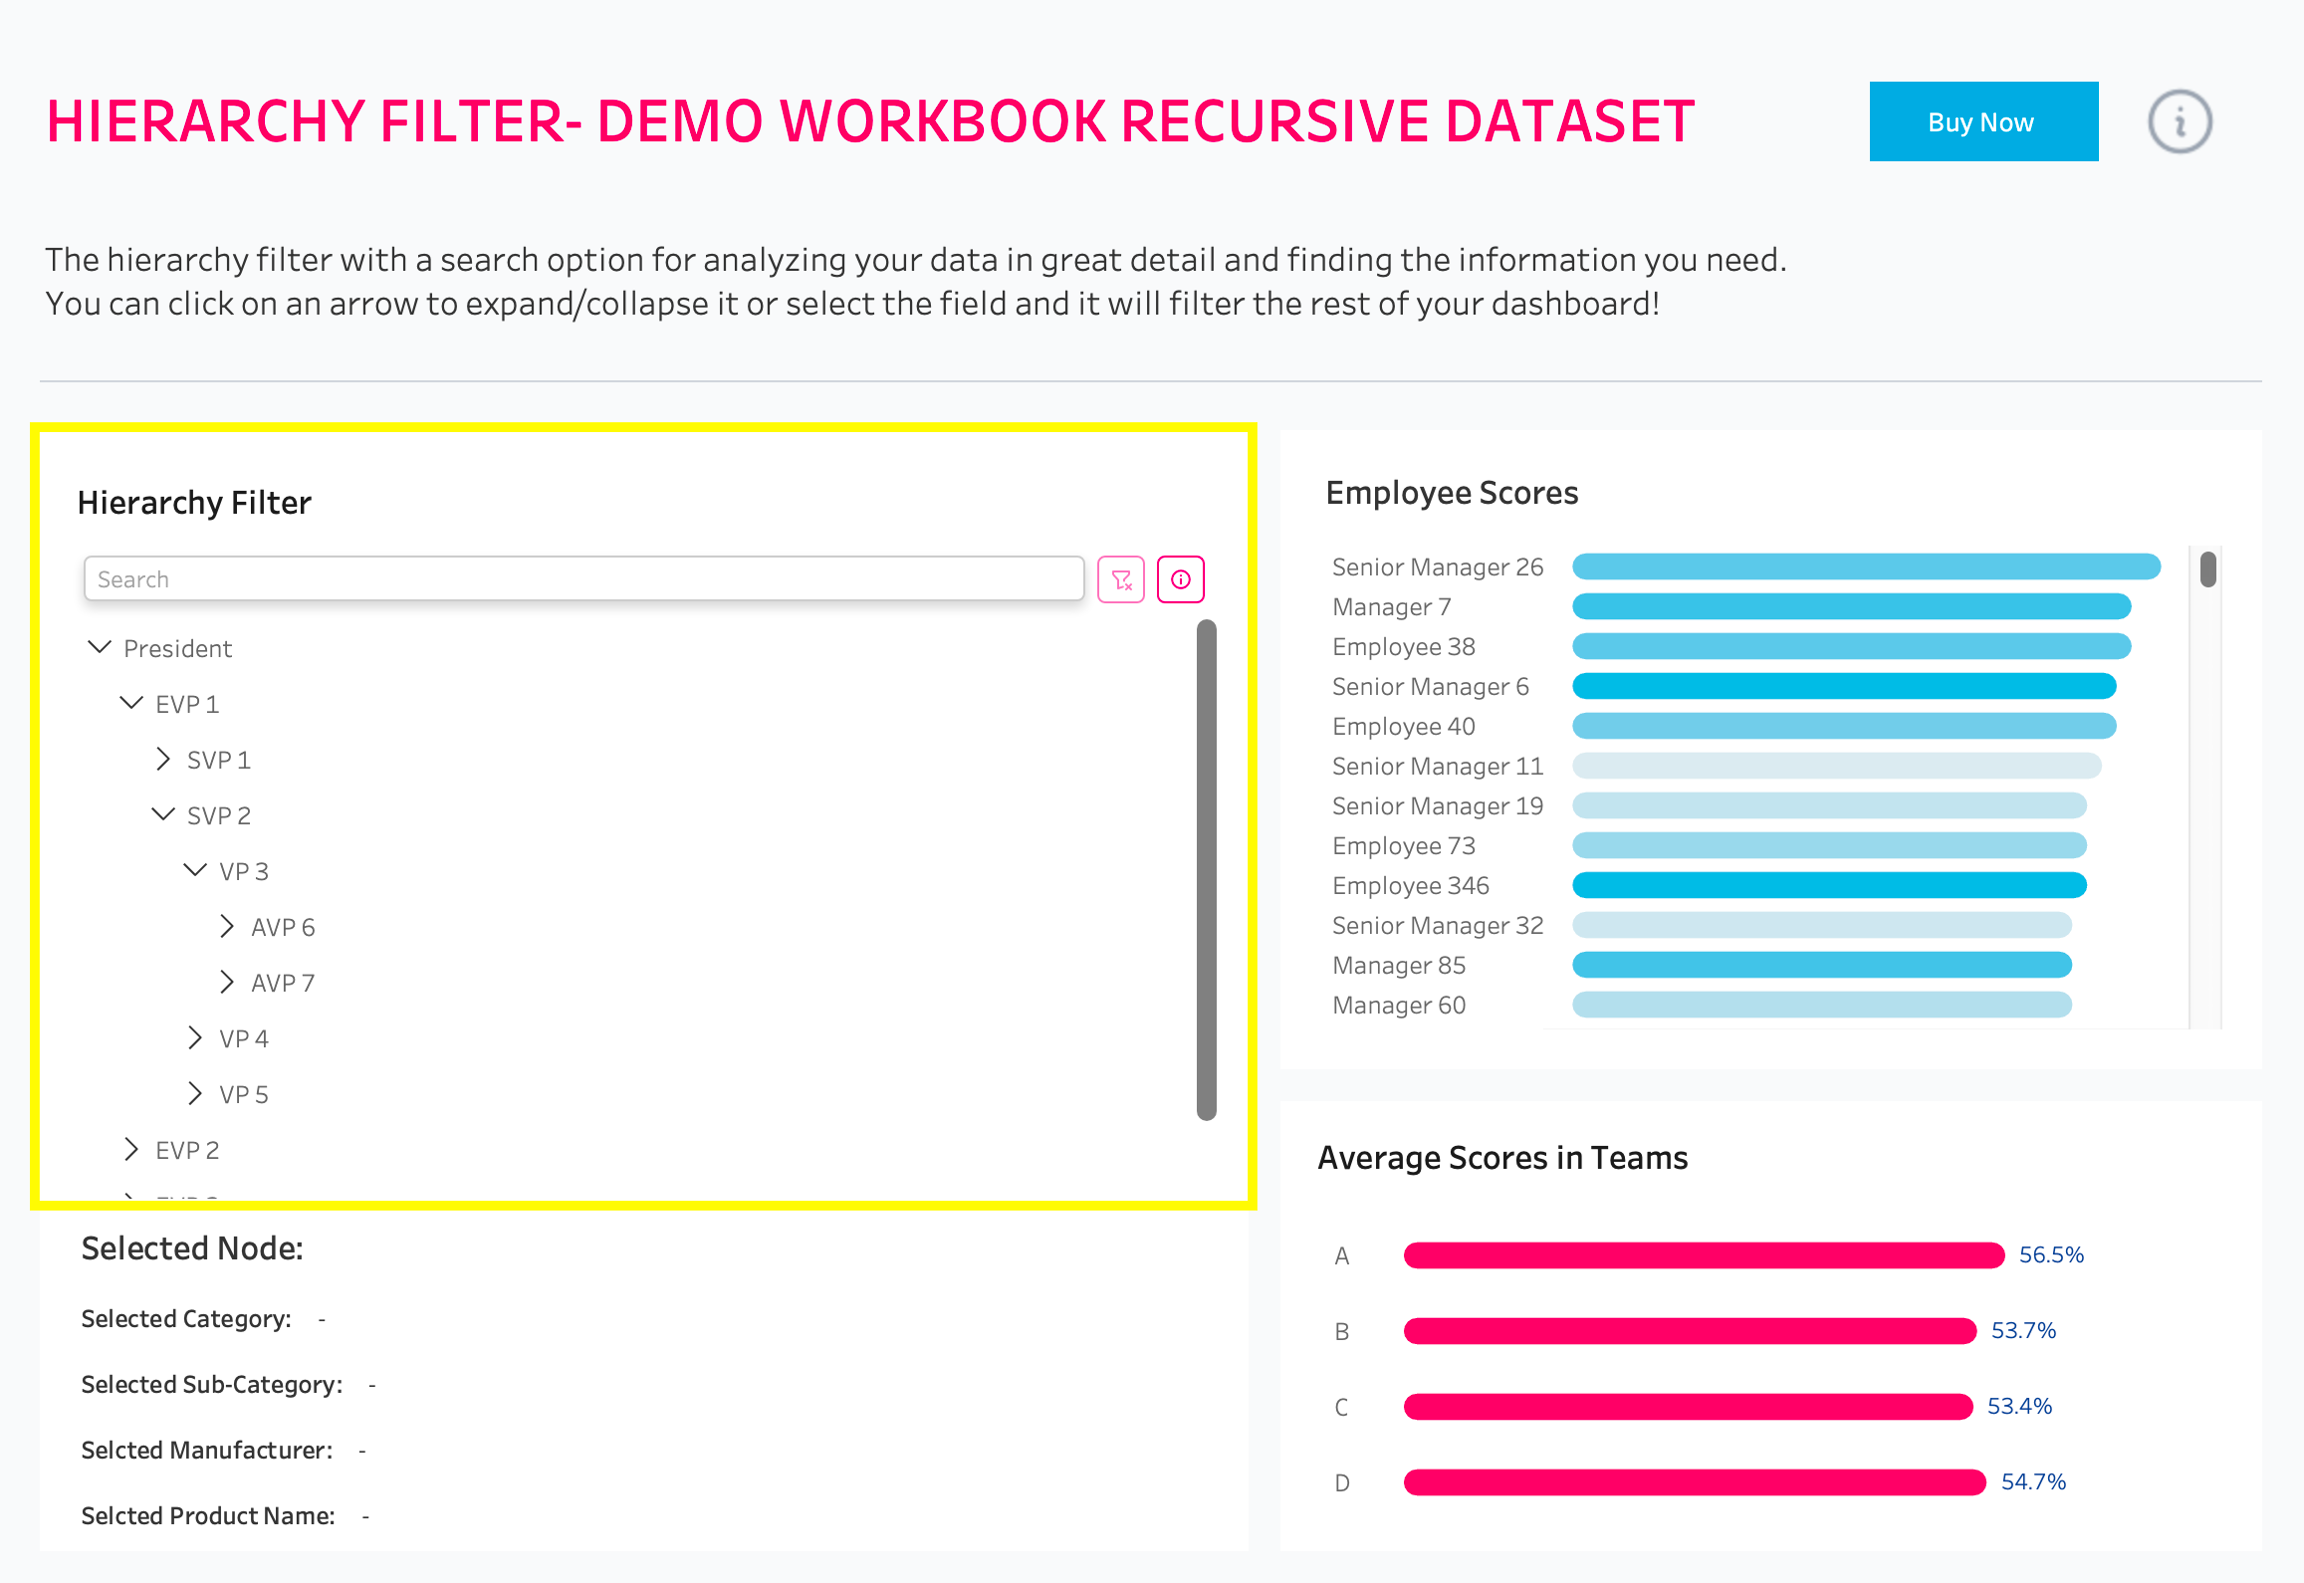
Click on next and after that on submit to save the configuration. Your tree should now be visible and fully operational in the dashboard.
Last updated
Was this helpful?