
Configure the HierarchyFilter
So we managed to prepare our datasheet for the hierarchical data model with the structure we want to use. We also set up a dashboard containing the HierarchyFilter extension. The next thing we need to do is configure the extension to use/visualize the hierarchical data and make the dashboard interactive.
To enter the configuration screen, select the container of the HierarchyFilter extension and from the dropdown context menu select “Configure” as shown in the below image (click to enlarge).

Configuration wizard
A configuration menu will pop up. The configuration consists of wizard-like steps, indicated at the top of the screen. This is shown in the example below.

Configuration page 1
In this part of the Product Guide we discuss the recursive model so we select the option “Recursive” from the startscreen of the configurtion wizard. Now when we press “Next” we move on to connecting the extension to the datasheet. In the screen below you see the second step of the wizard.

Configuration page 2
The marked areas need to be completed. First you select the sheet containing our Hierarchy data. The extension will read its content. From the second dropdown you select the Parent ID which is the ID of the manager and in our dataset that column is called “Manager ID”. Next field to address is the Child ID which in our dataset is called the “Employee ID”. Then we configure the Child Label. which will be the name of the node. In our dataset it is simply called “Label”
Next step of the configuration we will set the interactions and connect to the parameters we created.

Configuration page 3
On the interactions page, the first two options lets you select parameters to write tree selection data to. This is not necessary for a working HierarchyFilter.
The third checkbox under parameters enables reading from the label and child-ID parameters. this means that when one of these changes, the value is read and selected within the HierarchyFilter. This allows for a 2 way read-write system on both parameters.
Below the parameter selection are some options for sheet interaction:
Mark selection: Selects mark of rows of the data sheet when selecting node(s) in the tree. This is used to filter on the rest of the dashboard.
Multi-selection: Allows users of the tree to select multiple nodes at once by holding down control/command on the keyboard.
Filter: Filters the rows on the data sheet when selecting nodes in the tree. (to use this, a filter needs to be set up on the Calculated field).
Performance wise we recommend using Mark Selections when working with large datasets. Below you will see the screen for the final step of your configuration wizard (appears when you press Next).

Configuration page 4
This page is divided in three tabs.
General tab
In the first tab there are some general options to show/hide the search bar, buttons, tooltips and the title. The lazy loading option only loads visible parts of the hierarchy tree. This improves the performance significantly.
Next, using a string parameter, you can use the “Persist State” setting to set up HierarchyFilter to remember the current selection when moving between dashboards. The state is meaning the collapsed and uncollapsed layout and the selected node. While using the dashboard, the parameter will update to maintain the current state. When opening a new instance of the dashboard (different user, platform, etc), the parameter will open in the state it was in at the time the workbook was published. When loading the dashboard from scratch, the parameter (and thus the state) will be based on the state of HierarchyFilter at the moment the workbook was published.

Styling tab
The styling tab lest you customize the look of your tree. To change the font, the "use tableau font settings must be be enabled. The extension will then use the font and text color of your workbook. which you can change with the settings of Tableau.

Formatting tab
The last tab can be used to configure conditional formatting for your tree. This means that you can change the style of nodes based on the value of anything in the same row in the sheet.
First you need to select a numeric value column that will be used to determine if the target column should change its style. The value column needs to be placed as a detail on the sheet. you don't need to select it as a hierarchy field in page 2.
The target column wil be colored and will need to be one of the selected hierarchy fields on page 2.
After that, the bounds and colors for anything beyond the bounds need to be chosen.
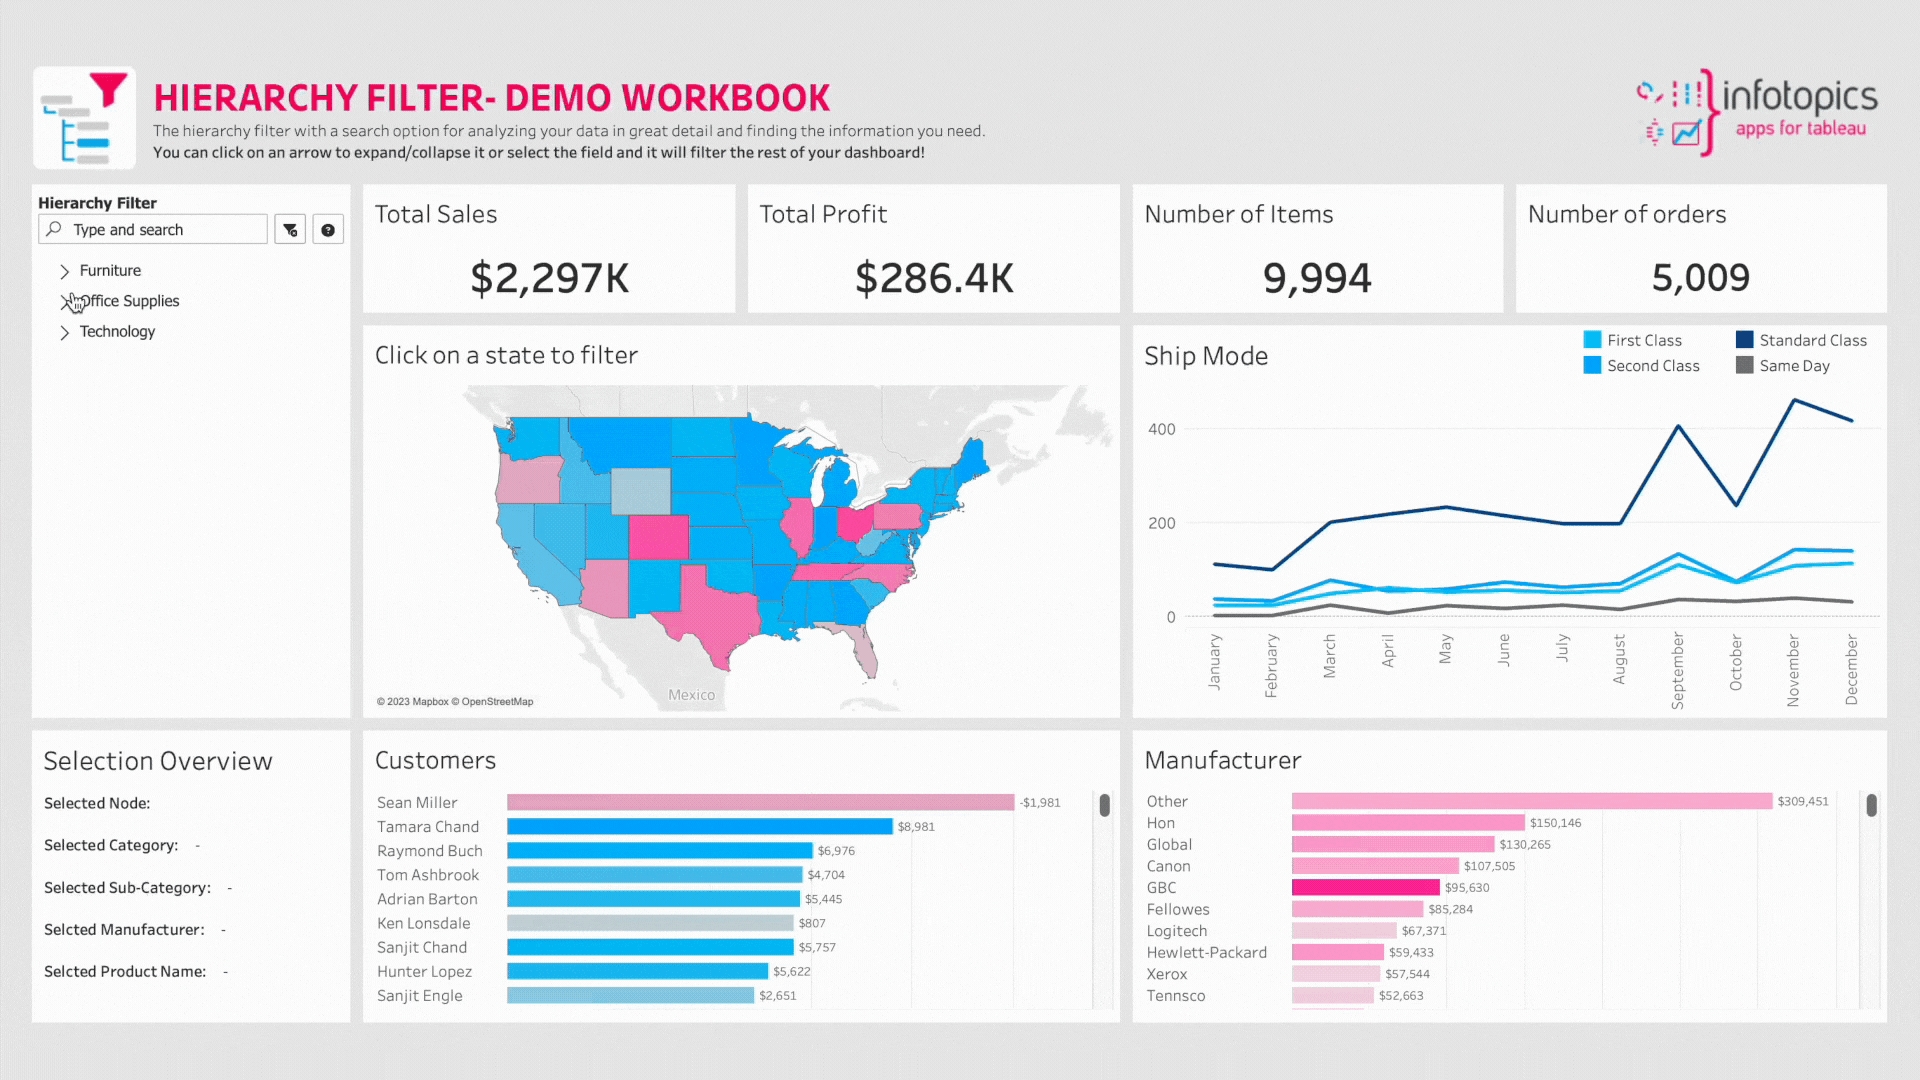
Once you’re satisfied with all the options you can press “Submit” and your configuration is done configuring your HierarchyFilter with the Dimensional model. You should see something like the image below and you can start exploring your hierarchy and enjoy the interactivity.

Selected Pills
When selecting a pill the chosen pill will be shown in the overview, helping users to see which filter(s) are live. Holding CTRL and clicking will allow users to select multiple. Deselecting or hitting the X on the pill will deselect the filter.
Last updated