> For the complete documentation index, see [llms.txt](https://docs.infotopics.com/llms.txt). Markdown versions of documentation pages are available by appending `.md` to page URLs; this page is available as [Markdown](https://docs.infotopics.com/supertables/configuration/configuration-screen/data-tab/dimension-data-pane/dimension-properties.md).
# Dimension Properties
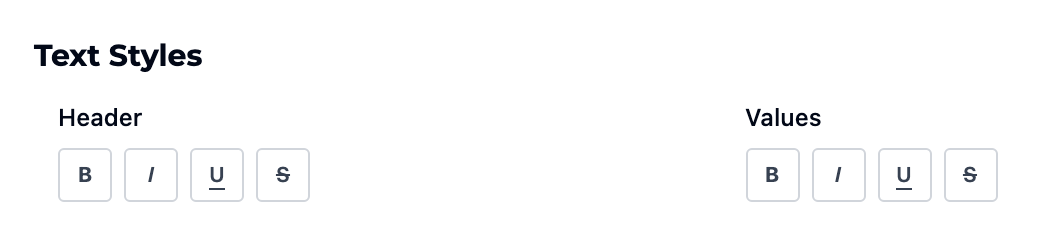
### Styles
Set the individual style of the Header and the Values in the table.
### Hide column in sidebar
Sometimes you want to use columns in a calculation but not show them in the SuperTable. Enable the "Hide column in sidebar" option if you wish to hide the column from the sidebar so users cannot enable this column.
Hiding a column in the sidebar
### Hide header name
Enabling the "Hide header name" option this will remove the column header from the SuperTable view.
Hiding a header name
### Hide inline filter
Hide the filter option for a specific dimension in the Supertables views. You see in our example it’s not possible to filter on Order ID but possible on Product Name.
Hiding inline filters
### Hide grand total
Hide the column total value. For instance you want to show the Sales total but not the quantity total in the total row of a grouped SuperTable, hide the total from your quantity column.
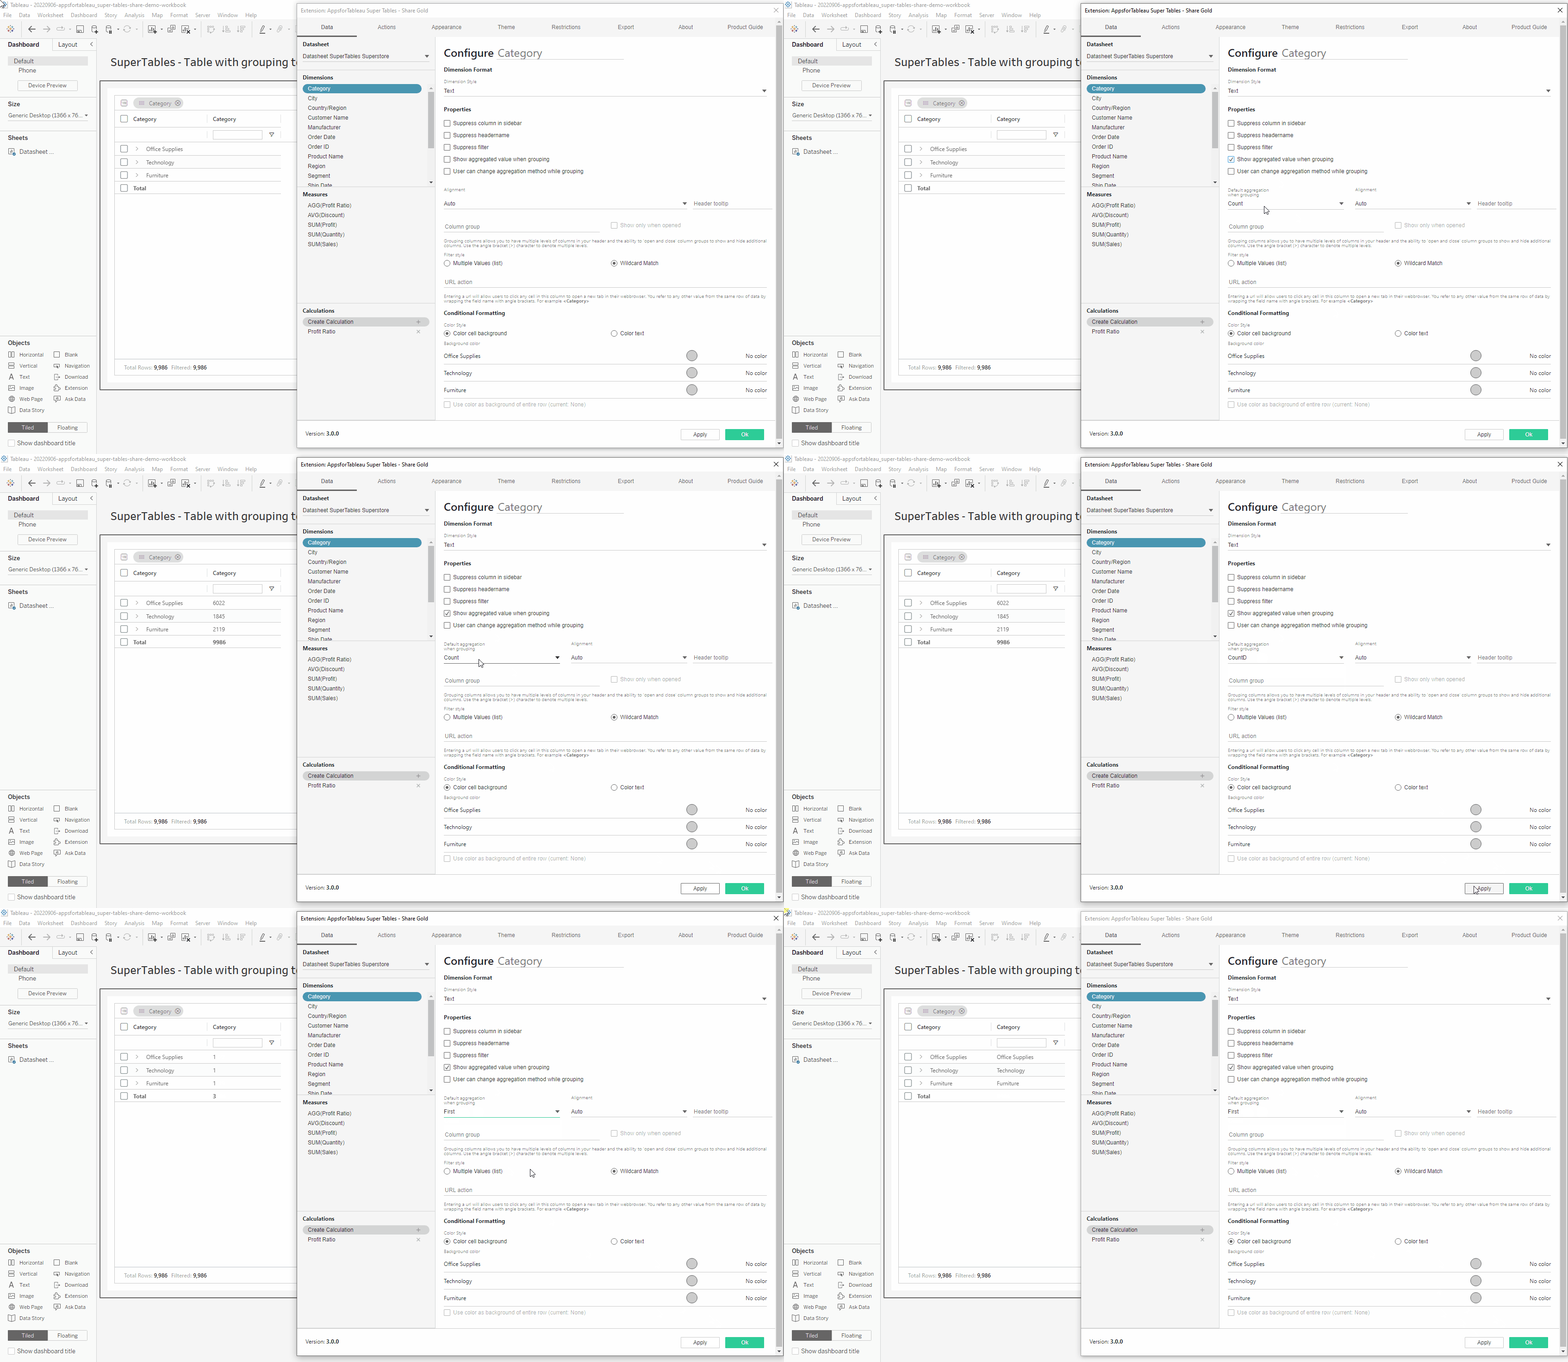
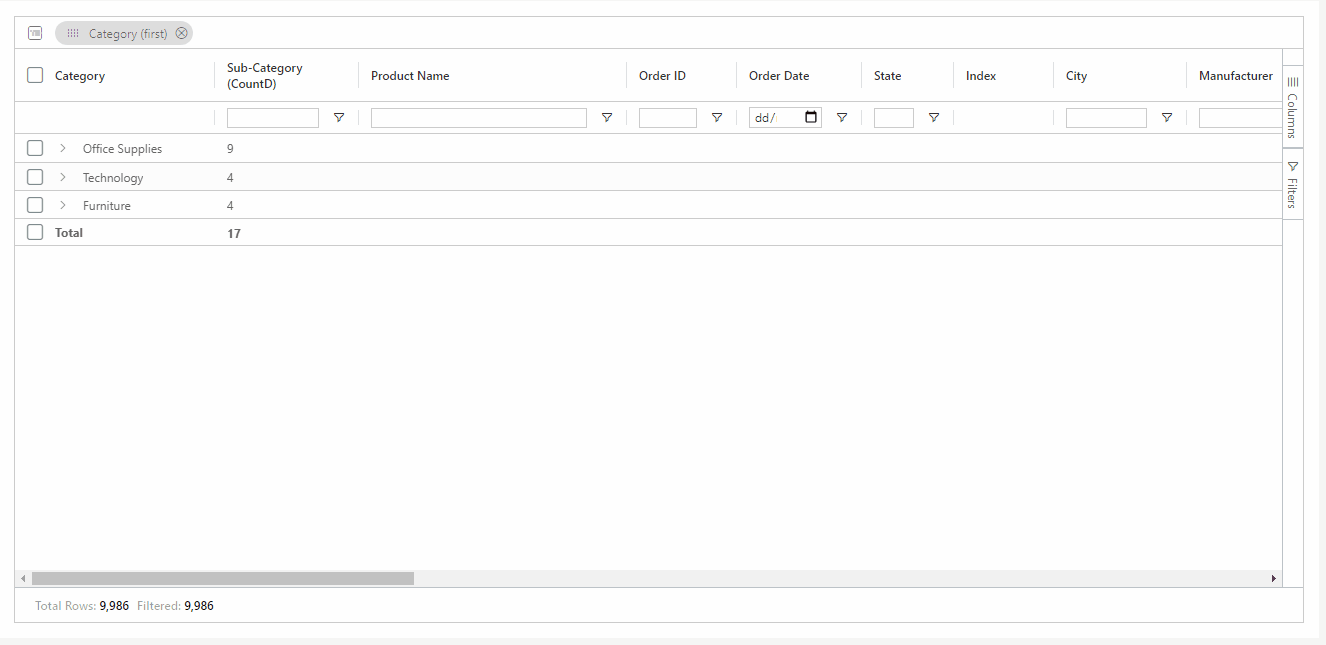
### Show aggregated value when grouping
When grouping a dimension show the aggregated value of the members in the group. Decide what the default aggregation should be which includes Count and now CountD!
### User can change aggregation method while grouping
### Alignment
Choose the alignment of the text within your SuperTables view, as well as the header of the specific column.
### Header Tooltip
Change the tooltip of your selected dimension. By default, it will show the dimension name. This tooltip is for the column header only.
Setting a custom header tooltip
The custom header tooltip
### Filter Style
***Multiple Values** (list)* – A dropdown to be able to show or hide values. The dropdown will contain all the values of the dimension.
***Wildcard Match*** – The column will show a search bar for this column to be used as an inline filter.
***Both -*** Both styles are applied.
Filter style
### URL Action
Entering a URL will allow users to click any cell in this column to open a new tab in their web browser. You can refer to any other value from the same row of data by wrapping the field name with angle brackets. You can of course also use a dynamically calculated field that contains a dynamic URL based on the content of that specific row of data. With this, you can set URL parameters to open a dashboard that has already been filtered on specific column values in your selection.
### Conditional color formatting
#### Color style
With this option, you can set conditional formatting. There are three options for conditional formatting:
1. Change the font color of the cell
2. Change the background color of the cell
3. Change the background color of the entire row
#### Background color
Use **Background color** to color rows based on specific dimension values.
To configure this:
1. Open **Format Extension**
2. Go to the **Data** tab
3. Select the relevant **dimension**
4. Scroll down to **Background color**
5. Define the value and the color you want to apply
6. Enable **Use color as background color of entire row** if the color should be applied to the full row instead of only the selected cell
This setting can be used when you want specific values in a dimension to drive row-level highlighting.
{% hint style="info" %}
Please note that you cannot configure colors for a dimension with more than 50 members.
{% endhint %}
---
# Agent Instructions
This documentation is published with GitBook. GitBook is the documentation platform designed so that both humans and AI agents can read, navigate, and reason over technical content effectively. Learn more at gitbook.com.
## Querying This Documentation
If you need additional information that is not directly available in this page, you can query the documentation by asking a question.
Perform an HTTP GET request on the following URL with the `ask` and `goal` query parameters:
```
GET https://docs.infotopics.com/supertables/configuration/configuration-screen/data-tab/dimension-data-pane/dimension-properties.md?ask=&goal=
```
`ask` is the immediate question: it should be specific, self-contained, and written in natural language.
`goal` is what the user is ultimately trying to achieve, the reason they need the answer. Sharing it helps GitBook give you a better, more relevant answer. A goal is most helpful when it describes the outcome the user wants rather than restating the question. For example, with `ask=how do I create an API token`, a goal like `automate deployments from our CI pipeline` lets GitBook tailor the answer to that use case.
The response will contain a direct answer to the question and relevant excerpts and sources from the documentation.
Use this mechanism when the answer is not explicitly present in the current page, you need clarification or additional context, or you want to retrieve related documentation sections.