> For the complete documentation index, see [llms.txt](https://docs.infotopics.com/llms.txt). Markdown versions of documentation pages are available by appending `.md` to page URLs; this page is available as [Markdown](https://docs.infotopics.com/supertables/configuration/configuration-screen/data-tab/dimension-data-pane/dimension-format.md).
# Dimension Format
Here, you can choose the style of your dimension. Plenty of options such as a Text field, a URL that can be rendered into an image, HTML, Markdown or even an emoji:
### Text
The text field will view similar to what you’d see in a Tableau table.
### Image
If your dimension holds data of an image URL, have that shown in your SuperTable. Add the width and height in px into the text boxes to set the proportions of the image. A good tip is to enable ‘**auto row height based on cell content**’ under the **Appearance** tab to enable larger images in the grid and have the row height automatically calculated. We suggest setting at least one of the dimensions of the image size for better layout control. Leave the width and/or height empty for auto-detection and show the full image (max sizes).
{% hint style="info" %}
You can use base64 encoded images by creating a column in your dataset or calculated field to store these values as strings.
{% endhint %}
### HTML
Would you like videos shown within your Supertable? If your data holds embedded HTML, choose HTML as your dimension Type.
### Markdown
Use the markdown language on your dimension. Such as header styles, # and more. Use this [website](https://www.markdownguide.org/basic-syntax/) to see the markdown language that can be used in SuperTables.
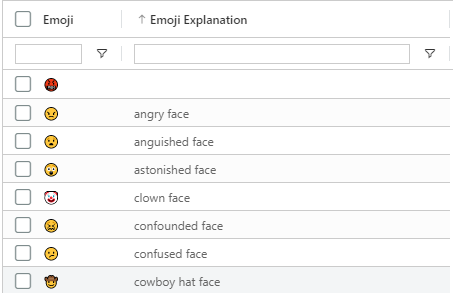
### Emoji
Using the emoji codes in your dataset, show emojis in your SuperTable.
You can find the emoji codes [here](https://www.quackit.com/character_sets/emoji/emoji_v3.0/unicode_emoji_v3.0_characters_all.cfm)
### Date Format
If your dimension is a **date** type, you can format the date in the view. For example “YYYY-MM” to 2025-05 for May 2025.
#### Filter date
Filter now on a date part including exact date or even a range of dates. Want to show data over a specific time, easily filter your date to show in your viz.
Formatted date fields in SuperTables can now be used for aggregation. So if you have an exact date field in your dataset, and format the column to show only Year and Month you can aggregate that column (using the grouping bar) on Year-Month and the exact dates are aggregated based on your date formatting.
\
\
---
# Agent Instructions
This documentation is published with GitBook. GitBook is the documentation platform designed so that both humans and AI agents can read, navigate, and reason over technical content effectively. Learn more at gitbook.com.
## Querying This Documentation
If you need additional information that is not directly available in this page, you can query the documentation dynamically by asking a question.
Perform an HTTP GET request on the current page URL with the `ask` query parameter, and the optional `goal` query parameter:
```
GET https://docs.infotopics.com/supertables/configuration/configuration-screen/data-tab/dimension-data-pane/dimension-format.md?ask=&goal=
```
`ask` is the immediate question: it should be specific, self-contained, and written in natural language.
`goal` is optional and describes the broader end goal you are ultimately trying to accomplish on behalf of the user. GitBook uses it to tailor the answer towards what is most useful for that goal.
The response will contain a direct answer to the question and relevant excerpts and sources from the documentation.
Use this mechanism when the answer is not explicitly present in the current page, you need clarification or additional context, or you want to retrieve related documentation sections.