> For the complete documentation index, see [llms.txt](https://docs.infotopics.com/llms.txt). Markdown versions of documentation pages are available by appending `.md` to page URLs; this page is available as [Markdown](https://docs.infotopics.com/showmemore/features/waterfall-chart/data-structure.md).
# Data structure
### Data structure for waterfall chart
This section outlines the necessary data structure for creating a waterfall chart. This type of chart can be utilized for various purposes, such as analyzing positive and negative contributions across different categories, comparing sales against budget, or understanding the breakdown from gross sales to net sales.
The following examples illustrate three distinct use cases to enhance comprehension of the extension's capabilities.
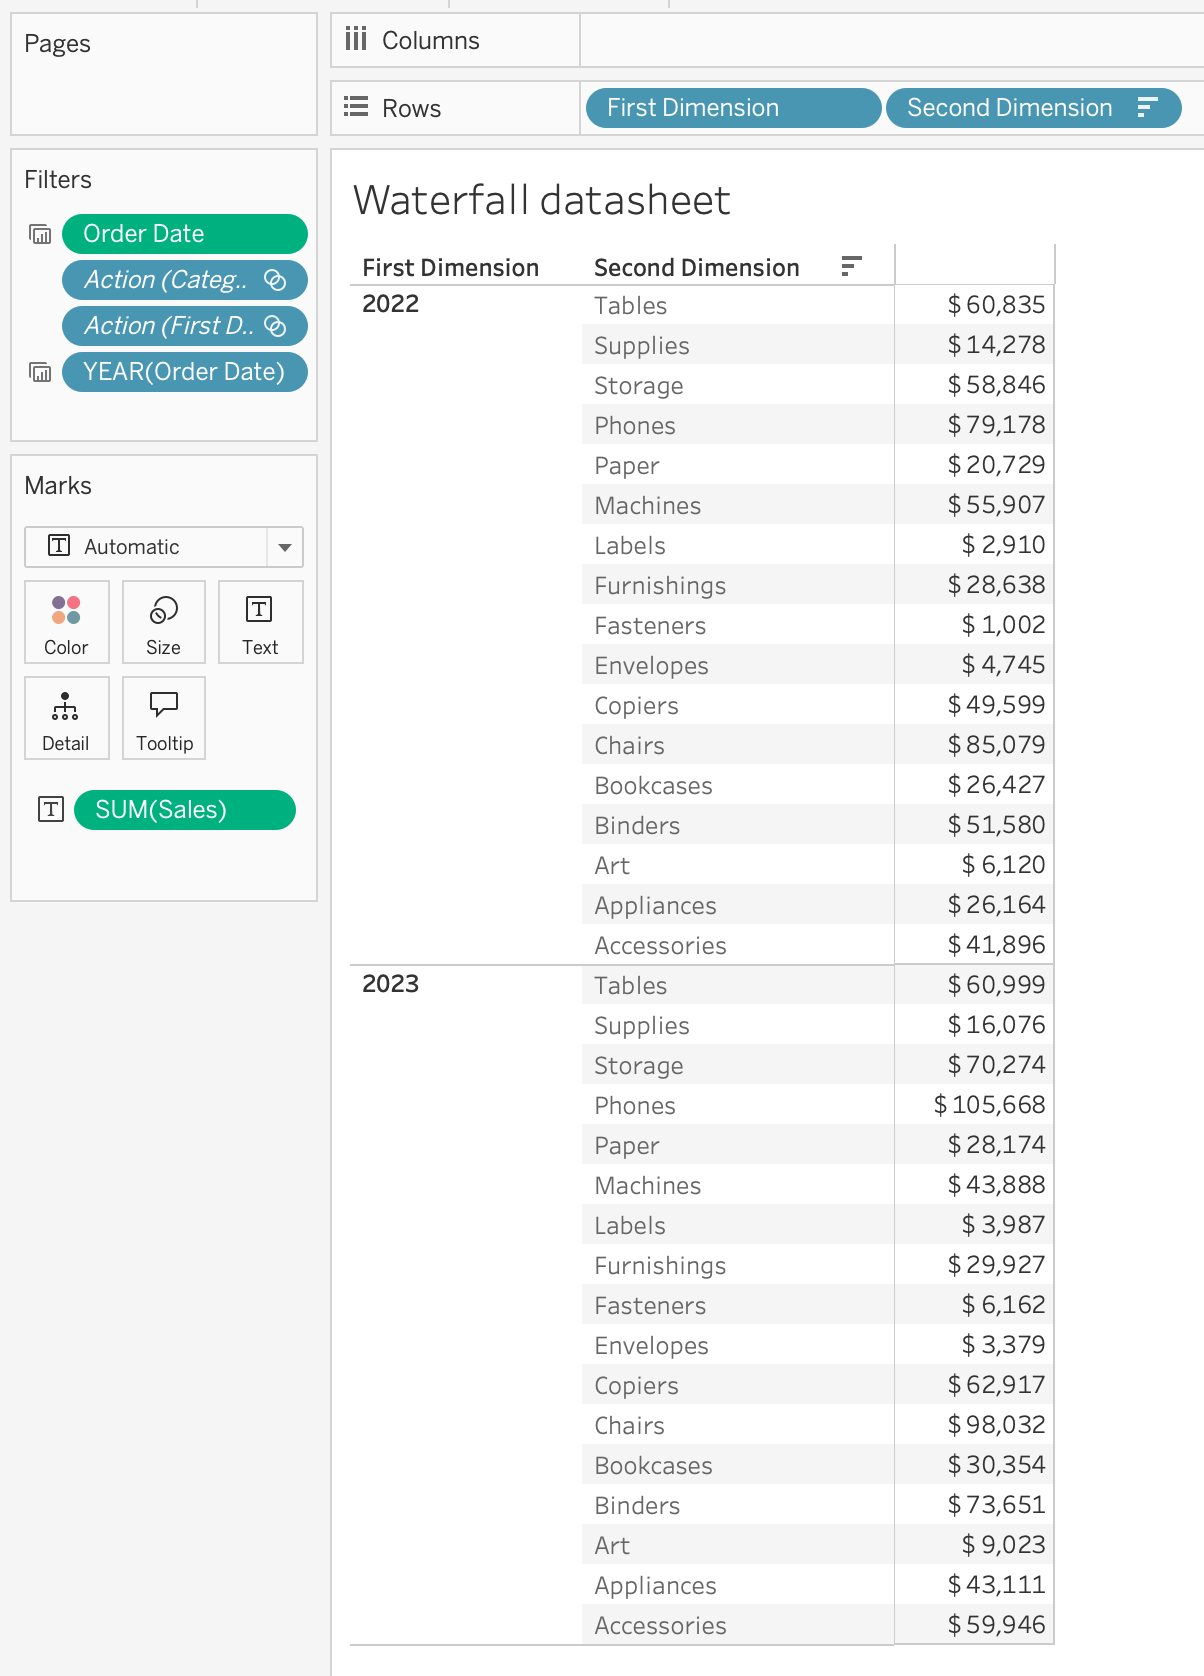
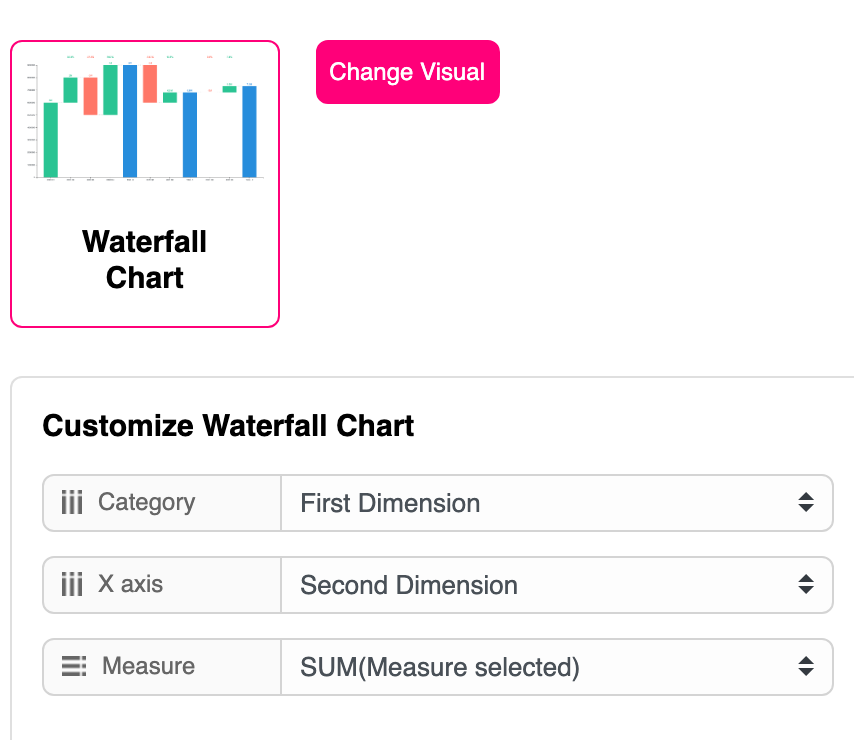
### **Aggregate first category: T**o understand positive/negative contributions
To understand the positive and negative impacts of various categories over time, we require two dimensions. The first dimension represents the aggregated higher order and is positioned as the first and last dimension (plotted as a category). The second dimension consists of the categories used for comparison, represented along the x-axis.
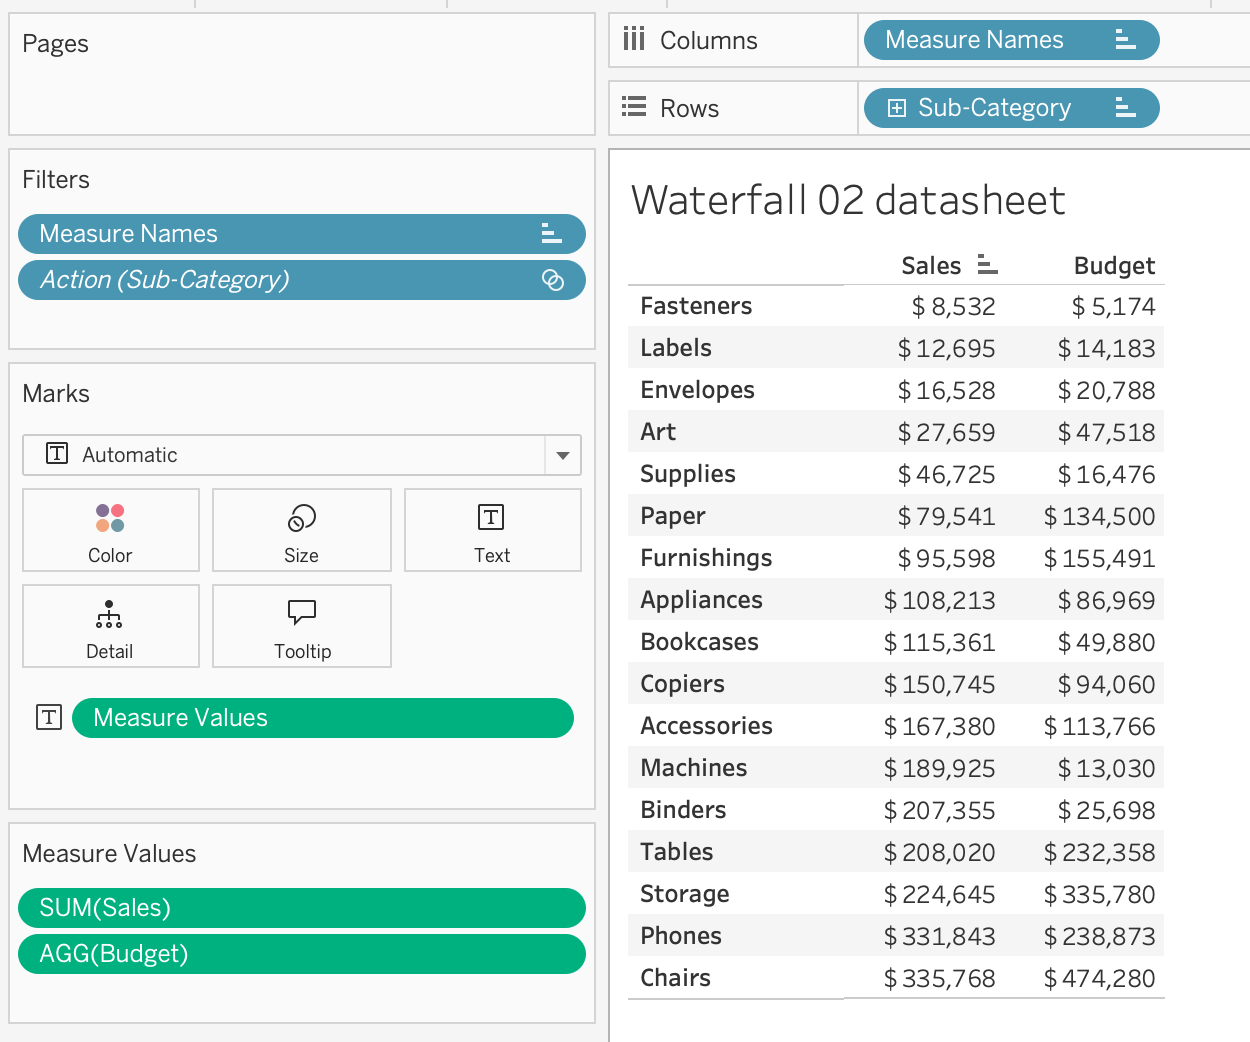
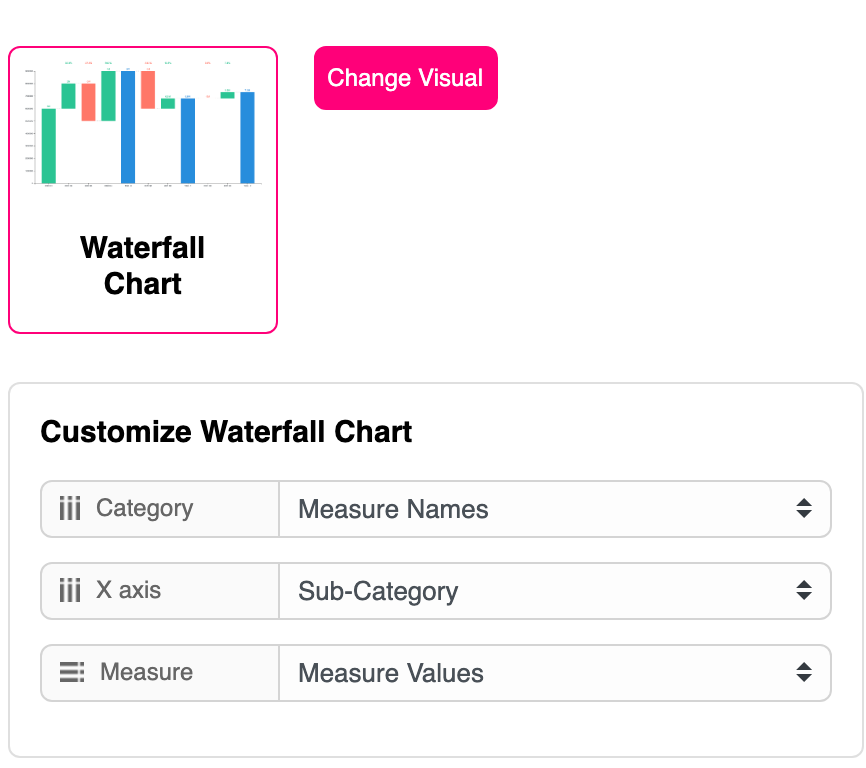
### **Comparison: To understand the** decomposition in subcategories between the budget and sales
To compare and understand the decomposition in subcategories between the budget and actual sales, we need two measures: the budget and the sales, along with the subcategories for each sales and budget figure. Similar to the previous section, categories are aggregated and represented as the first and last bars in the chart. The x-axis will represent the subcategories in this case. Since we need to pass two measures, we can utilize the Measure Values and Measure Names in Tableau.
### **Subtotal: To understand the conversation from gross sales to net sales**
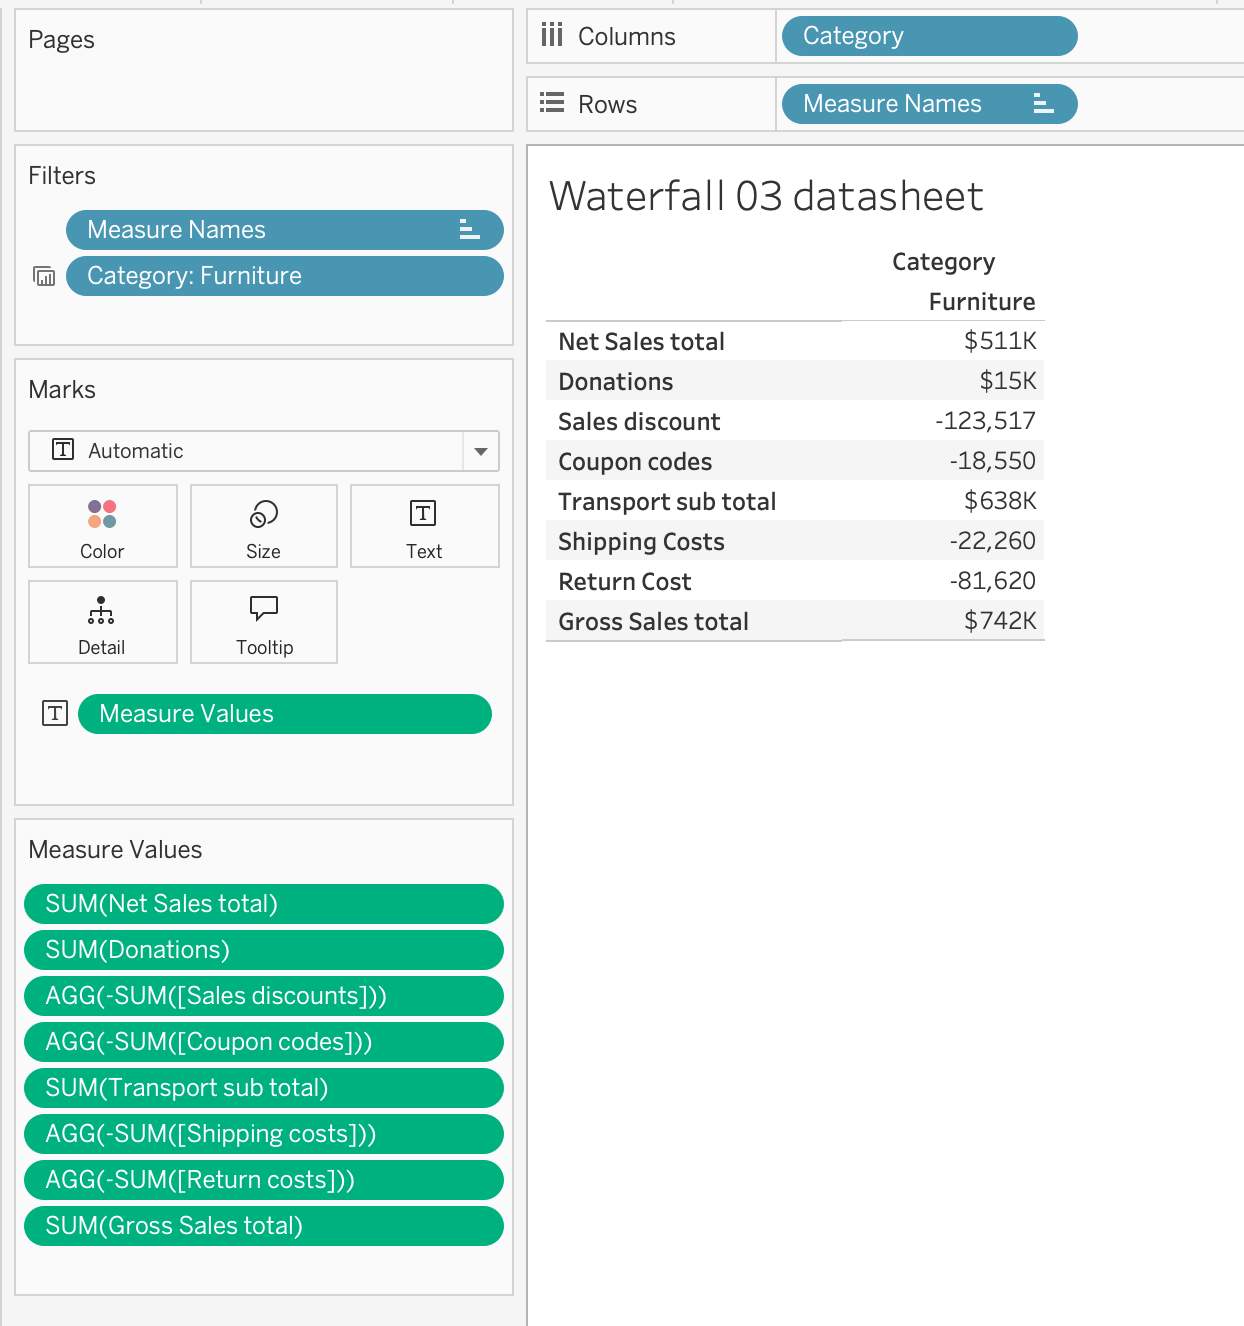
To understand the conversion from gross sales to net sales, we require information on both net sales and gross sales, as well as all expenditures. When preparing data in the sheet, you should place net sales and gross sales as the first and last items, respectively, with the remaining expenditure listed in between. This arrangement helps to facilitate the calculation of the conversion.
---
# Agent Instructions
This documentation is published with GitBook. GitBook is the documentation platform designed so that both humans and AI agents can read, navigate, and reason over technical content effectively. Learn more at gitbook.com.
## Querying This Documentation
If you need additional information that is not directly available in this page, you can query the documentation by asking a question.
Perform an HTTP GET request on the following URL with the `ask` and `goal` query parameters:
```
GET https://docs.infotopics.com/showmemore/features/waterfall-chart/data-structure.md?ask=&goal=
```
`ask` is the immediate question: it should be specific, self-contained, and written in natural language.
`goal` is what the user is ultimately trying to achieve, the reason they need the answer. Sharing it helps GitBook give you a better, more relevant answer. A goal is most helpful when it describes the outcome the user wants rather than restating the question. For example, with `ask=how do I create an API token`, a goal like `automate deployments from our CI pipeline` lets GitBook tailor the answer to that use case.
The response will contain a direct answer to the question and relevant excerpts and sources from the documentation.
Use this mechanism when the answer is not explicitly present in the current page, you need clarification or additional context, or you want to retrieve related documentation sections.